- 08:57:22 The latest Curmudgeon’s Corner podcast is out, mostly on Election 2016 this time, starting about 12 minutes in. https://t.co/tWHDA7fLh8
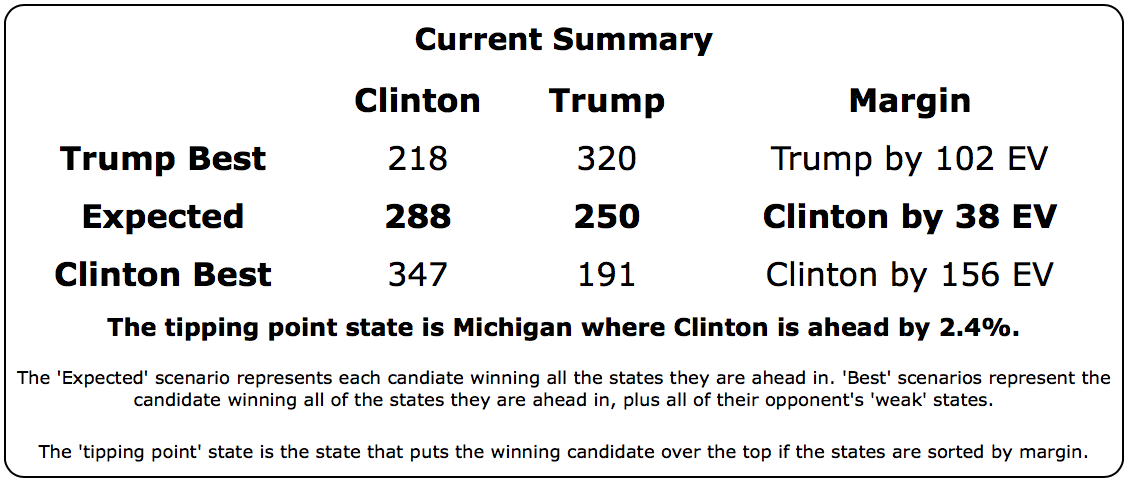
At long last, there has been enough state level polling in enough states over a long enough period of time that Trump makes it onto my “top five best polled candidate pairs” list. Until now, there simply was still more and better polling data around various other candidates, simply because they had been considered “contenders” for longer, and so therefore had amassed a wider variety of polls in more states. But no longer. It is time to look at Clinton vs Trump. The various ups and downs over the last few months should not be considered real changes in Trump’s support. Instead, it is simply the the “average of the last five general elections” starting point that I use for each state gradually being replaced with real polling data on Clinton vs Trump. So we’ll only start looking at trends and changes starting now. But where are we right now? With the usual caveats about how long it is until the election, lets do the rundown: So… Clinton wins based on the current state level polling. But it is close. The tipping point state only has a Clinton lead of 2.4%. So 1.2% of people nationwide changing their minds, or the undecideds leaning Republican, or a systematic polling bias… all could easily wipe out that lead. There is a lot of talk about how if Trump ends up as the nominee, we would see a Democratic win with margins unheard of since Reagan’s landslide over Mondale. This is by no means clear. People point to how uncomfortable people are with Trump. For instance this CBS/NYT Poll from today shows 64% of the voting public “concerned or scared” about Trump becoming president. Sounds huge right? How can anybody win with numbers like that? But then you notice that, wait, in the same poll, 57% of the voting public are “concerned or scared” about Clinton becoming president. When you put those two together, it isn’t at all clear how things would work when you put the two head to head. People talk about how Trump just couldn’t possibly win. How he alienates certain key voting blocs. How he will surely implode at some point. All sorts of reasons are mentioned. But a lot of them just boil down to “there is just no way, I don’t believe it.” And they may be right that he won’t win. The analysis above shows Clinton winning over Trump. Most head to head polling nationally that I have seen shows Clinton winning. RCP’s Clinton vs Trump average has Clinton up by 3.3% today. But all indications with polling today show Clinton vs Trump as close. Not a Clinton blowout. Now, to make explicit the caveat I noted at the top, there is a long time until the election. We don’t even have nominees yet. Trump winning the nomination is still one possibility among many. And even Clinton hasn’t wrapped things up yet. And a lot can happen in a campaign. General election polls this far out are NOT PREDICTIVE of the final result. They show us how things are RIGHT NOW at best. Things will move between now and next November. But is there any reason to believe that all of the movement will be toward Clinton? That people will see the Clinton vs Trump comparison as the campaign rolls on and all gravitate to Clinton? It COULD work out that way. But it is also quite possible that Clinton has bumps along the road that don’t look too great for her either. That the economy hits a rough spot. That Trump does what he has done so well against several primary opponents and finds just the right things to say at just the right moments to put Clinton in a negative light and turn people who were on the fence against her. Clinton may well win a Clinton/Trump matchup. In fact if I had to wager on it right now, I’d bet on Clinton winning. And there is a chance Clinton could indeed pull off a landslide after a Trump melt down. But this is not a clear and obvious result at this point. Trump could in fact pull off a win. From the current position in the polls, he only has to move things ever so slightly to get there. Clinton winning, but not in a blowout, but in a close competitive race, is actually a very likely outcome. Folks predicting that a Trump nomination automatically means a Democratic landslide… underestimate Trump at your own peril. He has shown time and time again over the last few months that the “conventional wisdom” can be dead wrong. He may yet implode. But this should not be taken for granted. Right now he tops the polls nationally and in all the early states for the Republican nomination. And the general election polls show him doing better than Romney did in both the electoral college and the popular vote. To be clear… not winning… but doing better than Romney did… and within reach of a win if just a few things slid his way. Looking for a second at other Clinton vs Republican pairings, and going past the “Top 5 best polled” combinations I usually talk about to pick up Rubio and Carson, lets see which of the Republicans are currently most competitive against Clinton based on my analysis. Here are the Top 5 Republicans in terms of how they fare in the Electoral College against Clinton:
All the other Republicans are even further behind. For comparison, Romney lost by 126 electoral votes. Rubio actually is slightly ahead right now, but barely. He is the only Republican who can say they are leading Clinton right now. But really Clinton vs Rubio, Carson, Trump and Bush are all in the “too close to call” category. For each of these four Republicans, the “best case”, where the Republicans pick up the states where Clinton is ahead, but by less than 5%, result in a Republican win. These races are all competitive. Cruz? Huckabee? Paul? Christie? None of these guys are even close in head to head matches with Clinton. Trump is not in that category. Although meltdowns are always possible, and indeed, he hasn’t even gotten the nomination yet… Clinton vs Trump certainly has a strong possibility of being a close competitive race. Do not underestimate Trump. 334.0 days until polls start to close on Election Day 2016. Buckle your seatbelt. Note: This post is an update based on the data on ElectionGraphs.com. All of the charts and graphs seen here are from that site. Graphs, charts and raw data can be found there for the race nationally and in each state for every candidate combination that has been polled at the state level. In addition, comparisons of the best polled candidate combinations both nationally and each in each state are available. All charts above are clickable to go to the current version of the detail page the chart is from, which may contain more up to date information than the snapshots on this page, which were current as of the time of this post. Follow @ElecCollPolls on Twitter for specific poll details as I add them. And like Election Graphs on Facebook!
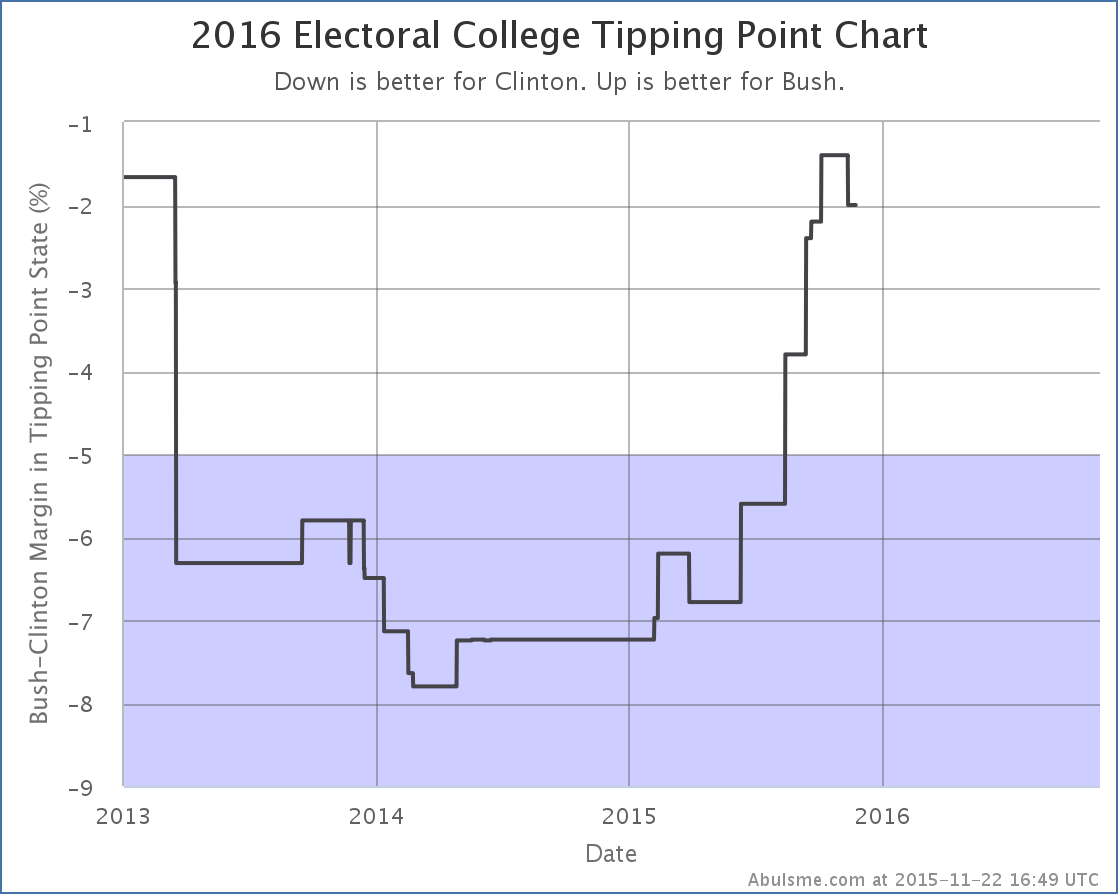
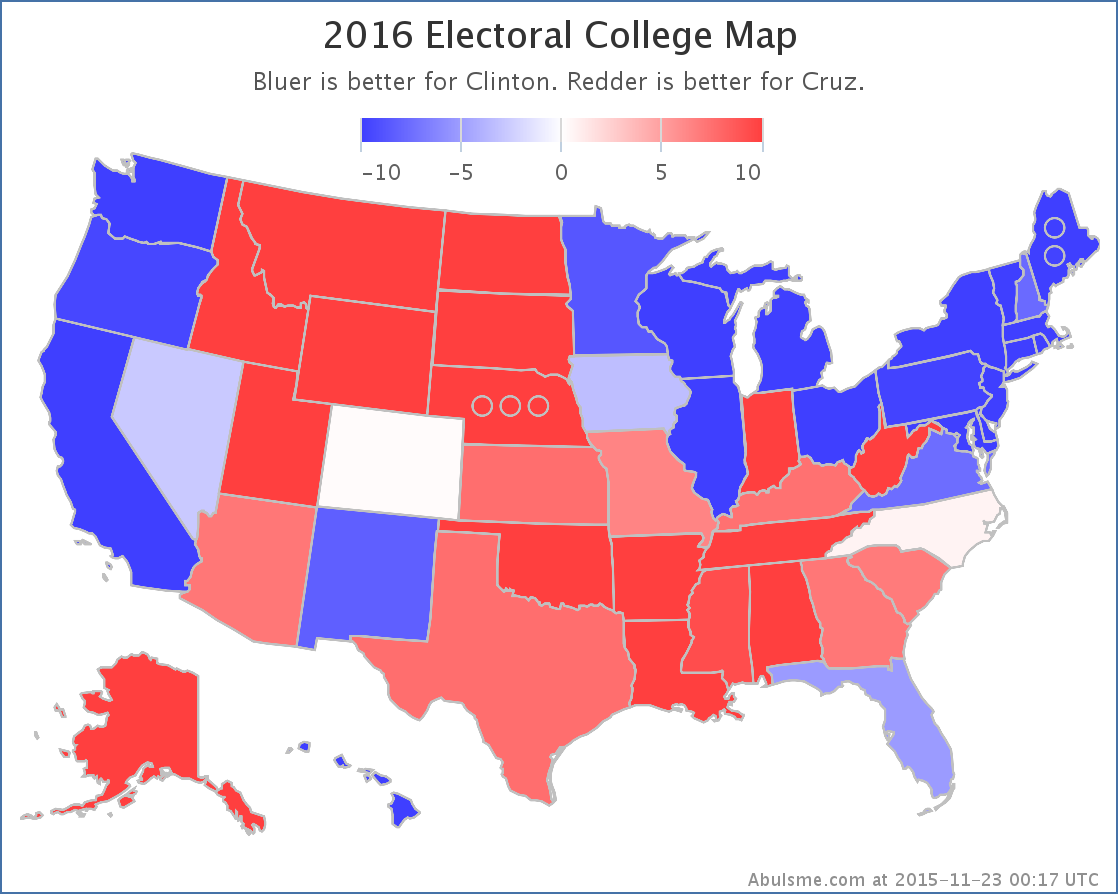
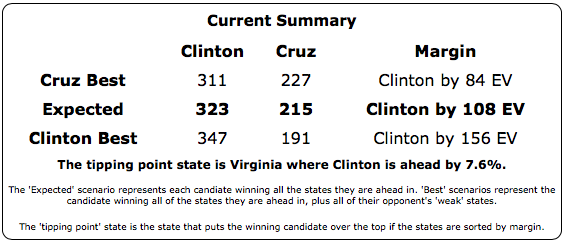
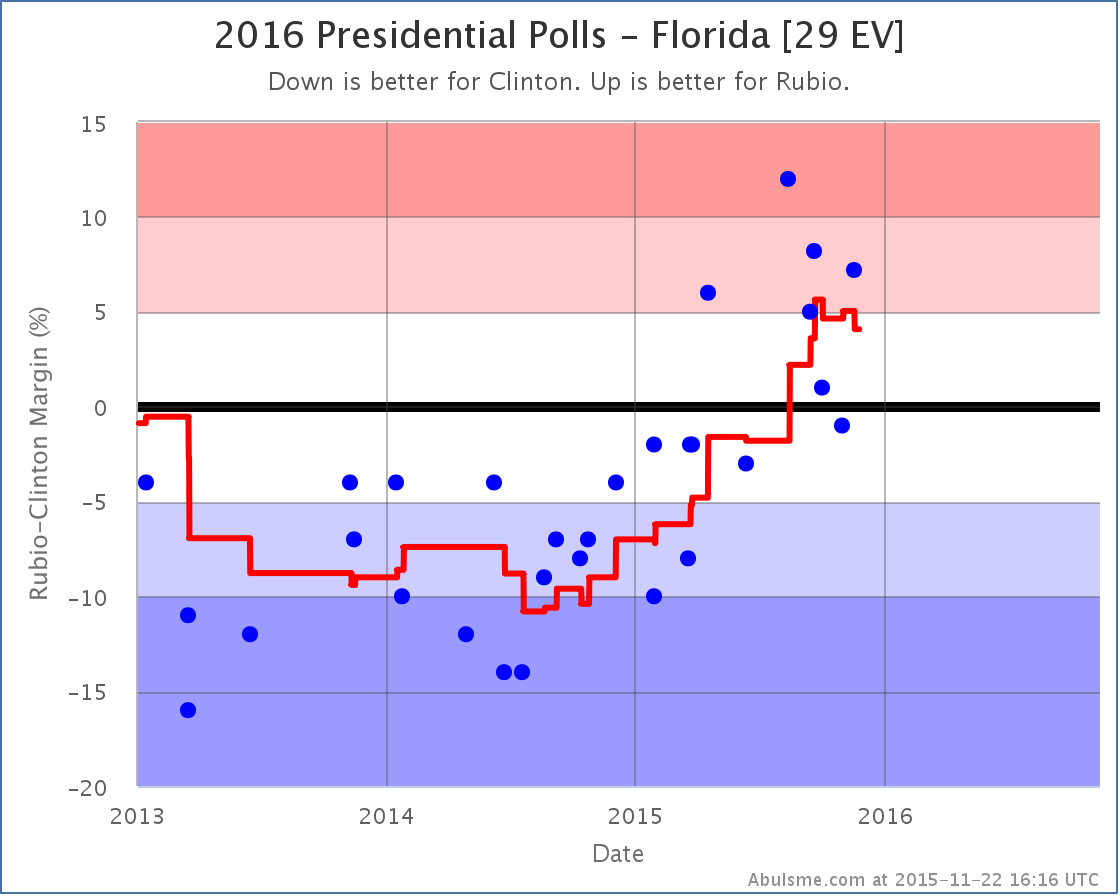
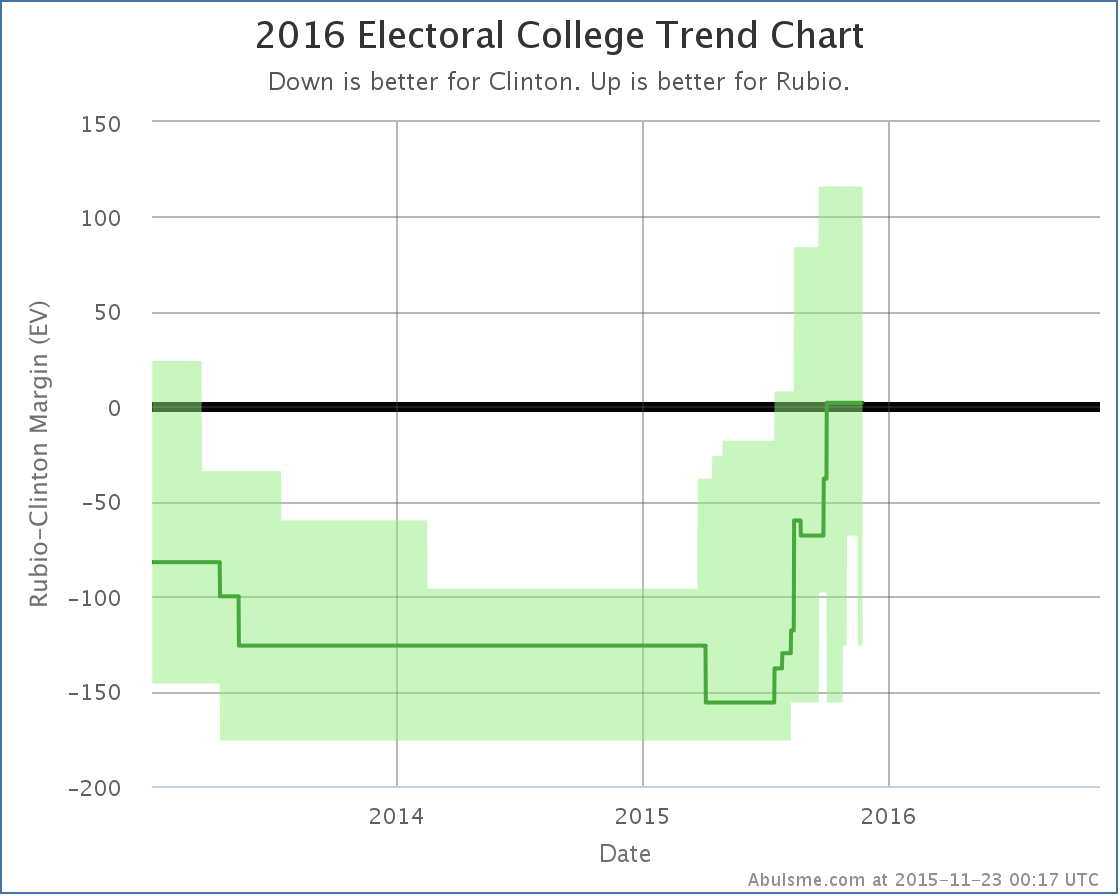
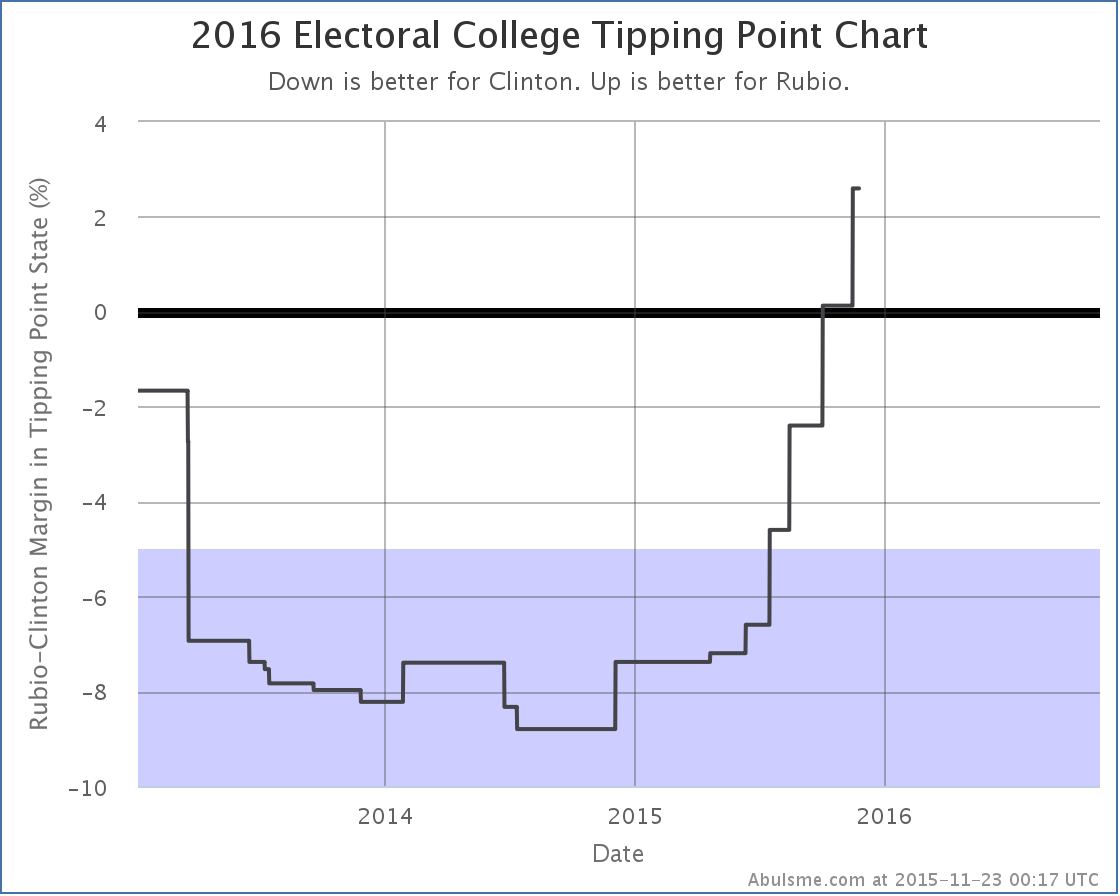
After a busy week including several days without power at Election Graphs HQ, I caught up on the 62 poll results that had been released in the last week. There were polls in eight different states (NV, IA, NH, SC, FL, CO, VA and WI) and for many different candidate combinations. With all of that though, there were only a few significant changes to the “best polled” candidate combinations that I comment on here. Clinton vs Bush (best polled) There were two polls for Clinton vs Bush in New Hampshire. Taken one by one, they show New Hampshire slipping back to the Clinton side of the fence for a few days, then back to a narrow Bush lead. Both taken together though, New Hampshire is in the same state as before this set of polls was included. This leaves the “expected case” at Clinton winning by 48 EV. There was also a poll in Virginia though, and while the state was “Weak Clinton” before, and “Weak Clinton” after, Clinton’s margin increased, and improved Clinton’s “tipping point” against Bush. As a reminder, the tipping point is the margin in the state that would push the winning candidate over the edge. This can also be thought of as the amount the national polls would have to shift (assuming all states shifted uniformly) to change the winner. So it is essentially how close the race is taking into account the structure of the electoral college. This is the first move toward Clinton in the tipping point against Bush since March. Is this a possible indication that Clinton has reached her floor and has started a rebound? Or is this just a blip, or something specific to Bush? Only more polls will tell. Clinton vs Cruz (2nd best polled) Since Clinton vs Cruz is just coming on to the five best polled list today, I won’t spend time looking at recent trends or changes. Instead, lets just look at where this combination sits right now: In other words, Cruz does pretty badly against Clinton at the moment. Rubio and Bush at least are making it close. Cruz is not. Clinton vs Rubio (7th best polled) Speaking of Rubio, with today’s update, Clinton vs Rubio actually falls off the “five best polled combinations” list, replaced by Clinton vs Cruz. I suspect Rubio may get back on this list soon, but in the meantime, here are the changes in this last update. After a couple weeks with Rubio’s lead in Florida over 5%, with the latest update, the average falls to Rubio +4.1%, again making Florida a “Weak Rubio” classification, meaning that while Rubio is ahead, the state is within reach for Clinton, and could easily flip. Florida is a big state, so this has a big impact on Clinton’s best case (where she wins all the Weak Rubio states in addition to the states she is actually ahead in). You can see the ragged lower edge of the “bubble” in the chart above. That is primarily Florida going in and out of the group of states considered possible for Clinton. For the moment, it is back in. The “expected case” is still Rubio winning by a razor thin 2 EV, but her best case is now back up to winning by 126 EV. So, Clinton strengthening? Well, maybe, but at the same time, another poll increases Rubio’s average in Colorado, in turn improving Rubio’s tipping point against Clinton: So, Clinton’s best case improves from winning by 68 EV to winning by 126 EV. But at the same time the tipping point moves from Rubio up by 0.1% in Colorado, to Rubio up by 2.6% in Pennsylvania. All in all this is a mixed bag of news, but on balance I’d say Rubio is better off here. So maybe don’t stock up quite yet on that Clinton recovery narrative. Others As usual, there are others getting lots of media attention currently that never-the-less have not yet had the sustained polling volume across a lot of close states to get on the “five best polled” according to my metric. This means looking at the results for those candidate pairs is a bit less reliable, but since there is continued interest, here are links to a few of those along with the current “expected” result for each:
351.9 days until the first general election polls start to close. A lot will change before then. Stay tuned. Note: This post is an update based on the data on ElectionGraphs.com. All of the charts and graphs seen here are from that site. Graphs, charts and raw data can be found there for the race nationally and in each state for every candidate combination that has been polled at the state level. In addition, comparisons of the best polled candidate combinations both nationally and each in each state are available. All charts above are clickable to go to the current version of the detail page the chart is from, which may contain more up to date information than the snapshots on this page, which were current as of the time of this post. Follow @ElecCollPolls on Twitter for specific poll details as I add them. And like Election Graphs on Facebook!
|
||


