Lets jump right to it. In the last Democratic update we mentioned that to actually improve the “% of remaining needed to win” Sanders needed to get 54.36% of the delegates available in New Hampshire. That would be 14 out of 24 delegates that were available today. He got 15 out of 24, or 62.5% of yesterday’s delegates. So he did it!
In addition, since my last update, there were some superdelegate changes. The net change from those was +1 Clinton, +1 Sanders. There was also a net reduction of 1 available delegate, bringing the total number of Democratic delegates down to 4,763.
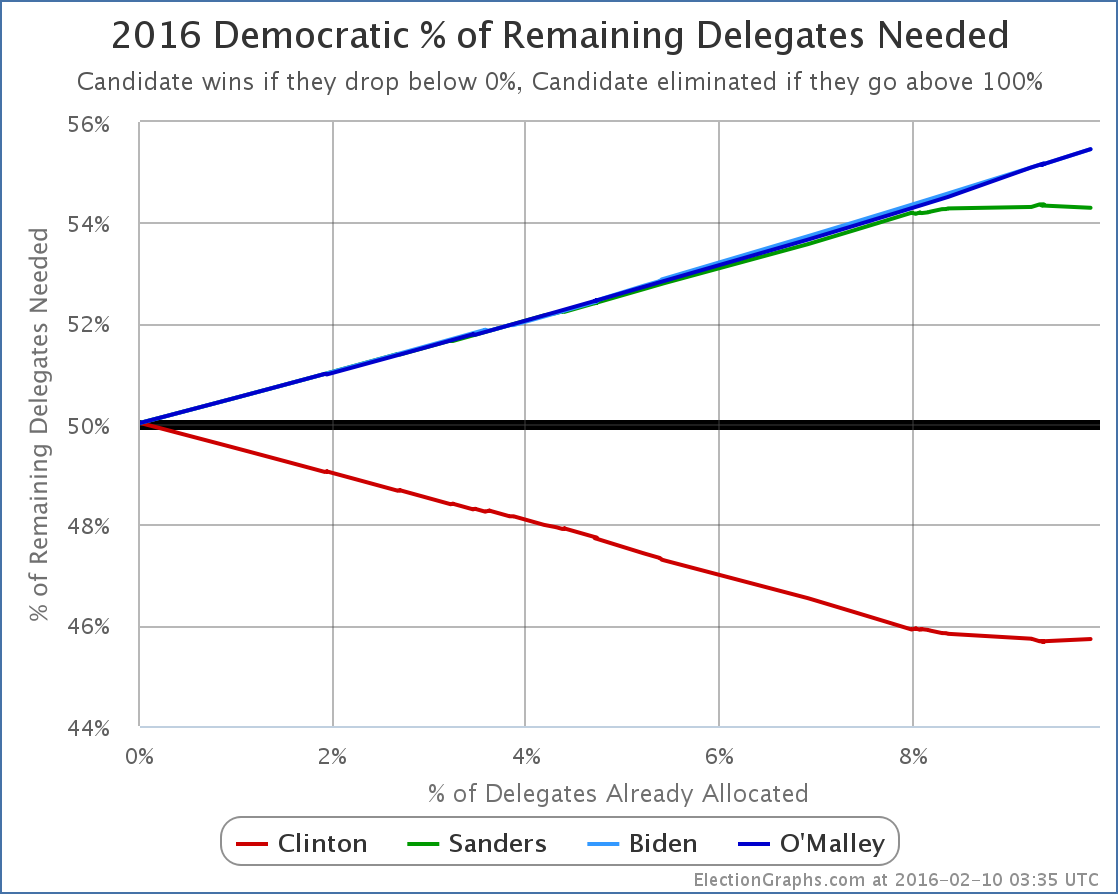
With all of that in place, here is the new chart for “% of remaining needed to win”:
The Sanders % Needed has indeed gone down, and he made Clinton’s go up!
Sanders’ % Needed specifically moved from 54.36% to… 54.30%.
This was at 54.22% before Iowa. 54.30% matches where this was right after Iowa.
So, Sanders did improve his situation, but only enough to undo the superdelegate changes that happened after Iowa, not enough to get back even to where he was before the voting started.
Another way to look at this is to just look at New Hampshire itself. Of delegates allocated by the Primary, Sanders got 15 delegates to Clinton’s 9. But New Hampshire also has 8 superdelegates, and 6 of these had already declared for Clinton.
So the actual New Hampshire total as of today is 15 Clinton, 15 Sanders, 2 TBD.
So even with his big win, which was indeed a big win, Sanders actually has only pulled even in delegates in the state.
Now, of course, superdelegates can change their mind. It has been said that if one candidate was clearly leading absent superdelegates, the superdelegates would not go against them, and would start to change their minds and flip to the candidate leading in non-super delegates. Maybe. It could happen. And if it does, that movement will be tracked here. Certainly no such movement has been seen yet.
In the mean time, next up for the Democrats is Nevada on February 20th. Nevada often gets relatively little attention compared to South Carolina, but Nevada will actually be the next place where we see if Sanders is able to take his New Hampshire results and build anything longer term out of it.
Nevada is a caucus state, so delegates won’t actually be allocated on the 20th, but there will be results that can be used to estimate convention delegates. Nevada has 43 delegates. Of those 8 are superdelegates. Clinton already has 3 superdelegates in her column, Sanders has 1. Nevada’s caucuses will determine 35 delegates. 23 will be allocated based on results in the 4 congressional districts, 12 will be allocated based on the state wide results.
To once again have a result that keeps him on pace to catch up to Clinton and win, Sanders needs to get 20 of the 35 delegates available on caucus day, assuming no additional superdelegate declarations or other adjustments between now and then.
At the moment, Nevada poll averages show Clinton leading 50.0% to 30.5%… but there has been no polling there since December. Expect a variety of new polls in the next week. Watch them carefully. For Sanders to be on track, these numbers have to flip… and then Sanders has to build an even larger lead.
In South Carolina, a week after Nevada, Clinton is even further ahead, although again polls there are stale and new ones taken post-Iowa post-New Hampshire are eagerly awaited.
Between now and Nevada, and probably between now and South Carolina, there will be almost non-stop talk about Sanders’ threat to Clinton, how Clinton is a lot weaker than expected, how vulnerable she is. A lot of this is true. To a degree.
But to evaluate if Sanders is actually a threat to Clinton eventually taking the nomination, as opposed to just being a temporary speed bump in her way, Sanders has to not only take the lead in Nevada, South Carolina and beyond, but be ahead by a significant margin, not just a little bit. This is a tall order. Maybe it is possible.
But if there is talk about how Sanders is “closing the gap” or “making it closer than expected” in Nevada or South Carolina, keep in mind that isn’t enough. He needs to actually win and win by a large enough margin to get more than 54.30% of the delegates to be on pace to catch up and win. Otherwise, the task in later states just becomes even harder.
Note: This post is an update based on the data on ElectionGraphs.com. Election Graphs tracks both a poll based estimate of the Electoral College and a numbers based look at the Delegate Races. All of the charts and graphs seen in this post are from that site. Additional graphs, charts and raw data can be found there. All charts above are clickable to go to the current version of the detail page the chart is from, which may contain more up to date information than the snapshots on this page, which were current as of the time of this post. Follow @ElectionGraphs on Twitter or like Election Graphs on Facebook to see announcements of updates or to join the conversation. For those interested in individual general election poll updates, follow @ElecCollPolls on Twitter for all the polls as they are added.


