- 18:31:44 [Blog Post] Electoral College: Trump tipping point decline, Rubio takes lead in Michigan and nationally https://t.co/8V0bJUHQ5X
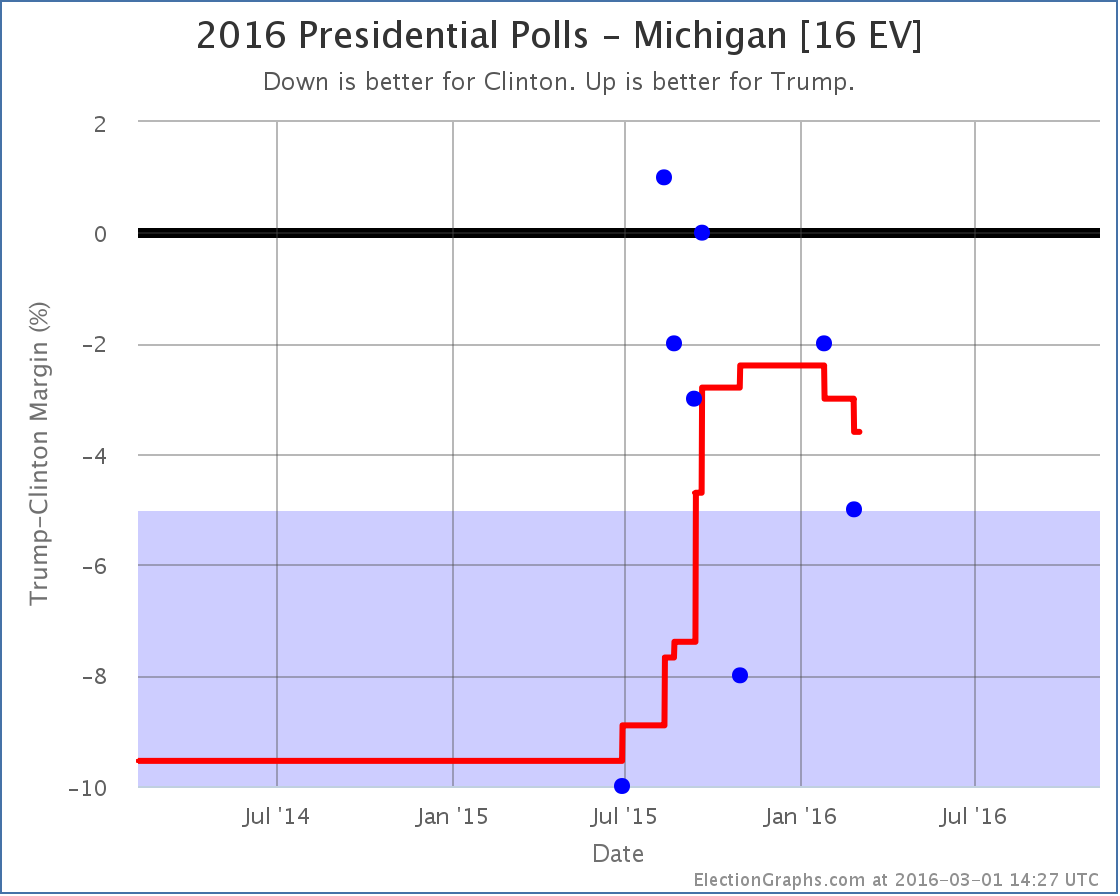
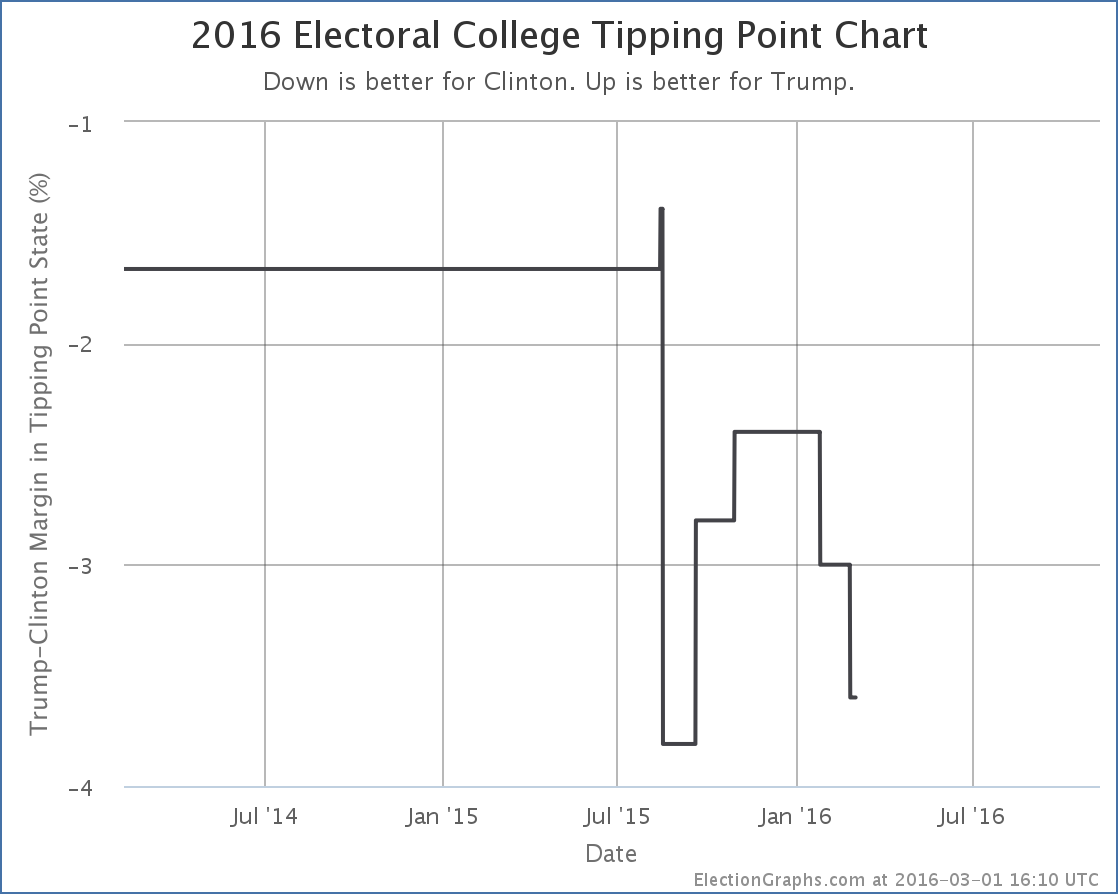
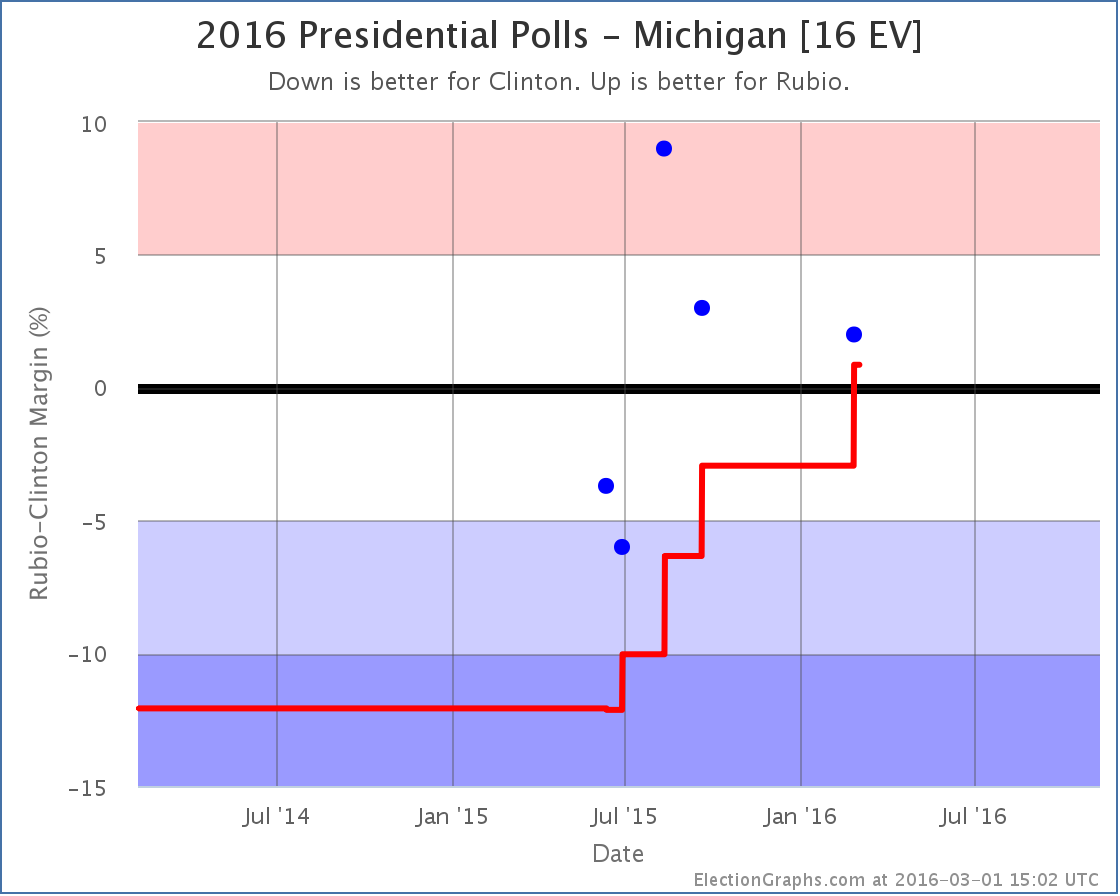
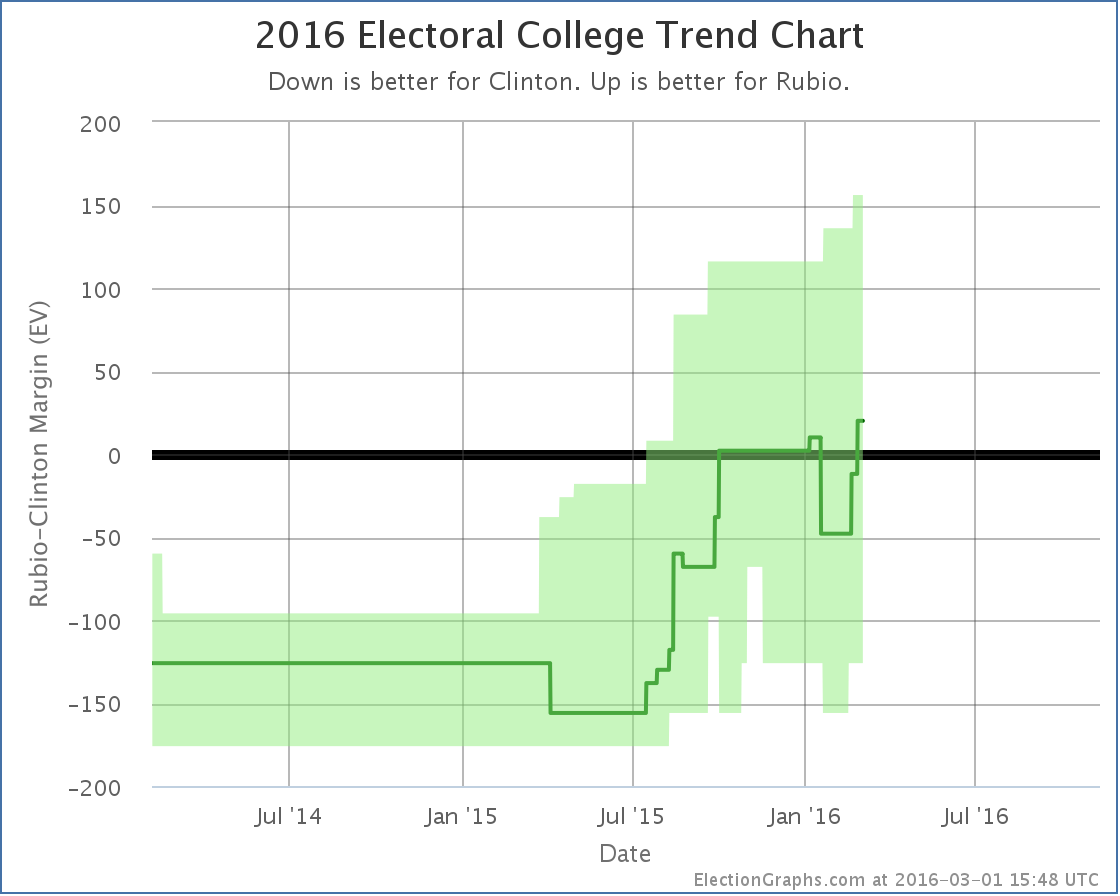
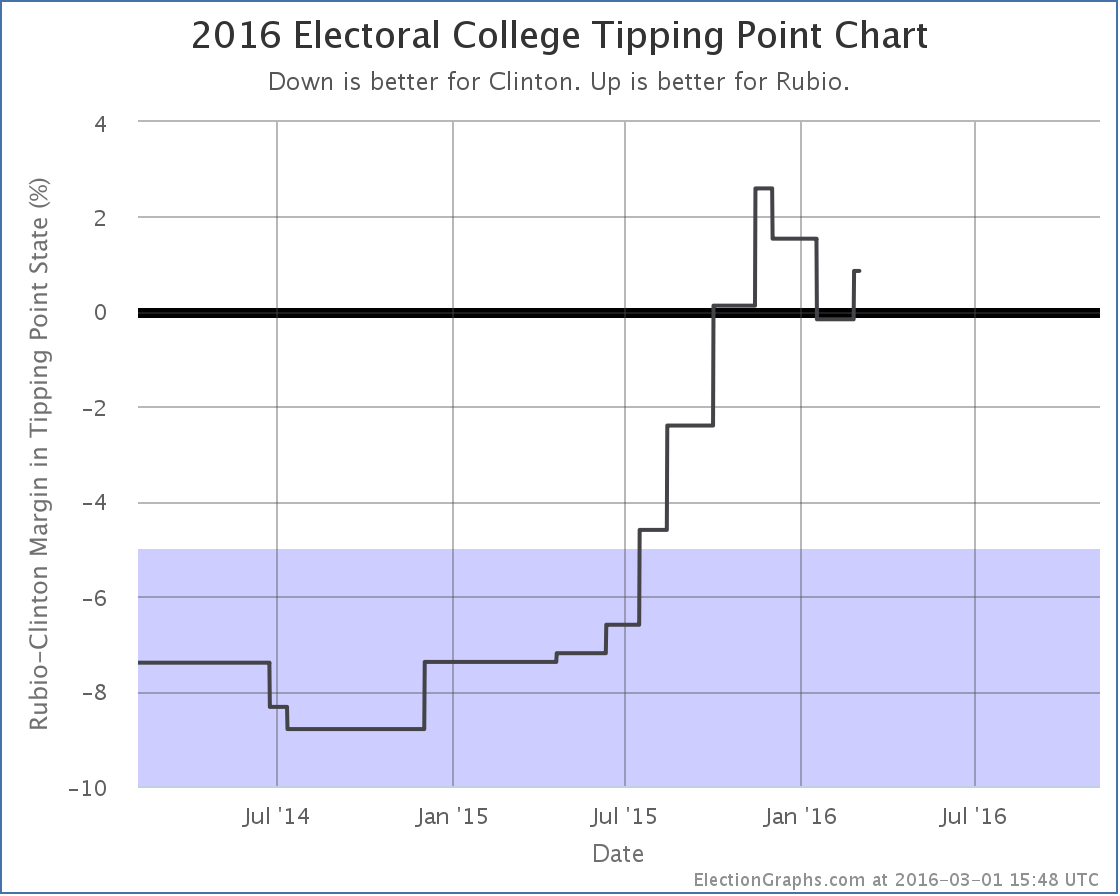
Yeah yeah, Super Tuesday. Yeah, yeah, all the other states coming right afterwards. But we have new general election polls! Since my last update there have been new polls in Michigan, New Hampshire and Kansas. From all of this, two major candidate pairs had changes to their summary status on my site. And this time, that includes the frontrunners: Clinton vs Trump The categorization of Michigan did not change. “Weak Clinton” before, “Weak Clinton” now. But Michigan was the tipping point in Clinton vs Trump, so when Michigan moves, so does the tipping point: The tipping point moves from a 3.0% Clinton lead in Michigan to a 3.6% Clinton lead in Michigan. Either way, 3.6% is still a narrow lead. Only 1.3% of people changing their minds, or undecideds flipping the right way, would put Trump in the lead. The question is if we are now in a trend away from Trump in this metric, or if we are just bouncing around in a range as new polls jitter the averages. Too soon to tell. But once the primary races are both settled to the point where it is hard to deny the winners are the winners, we will start seeing an acceleration of general election polling, and we should start to see if there are really any trends here. Clinton vs Rubio With the latest Michigan poll, Rubio leads in the poll average, which now shows a 0.9% Rubio lead. This moves Michigan from “Weak Clinton” to “Weak Rubio”. It is a close state that could easily go for either candidate, but with this change we move Michigan’s 16 electoral votes into Rubio’s column for the “expected” case where each candidate wins every state they are ahead in. The move is extra significant this time because it actually puts Rubio over the top to win the whole shebang: With this, the range of possible outcomes that seem reasonably possible is still everything from Clinton winning by 126 to Rubio winning by 156, but the expected result is now a Rubio win by 20 electoral votes. This is also reflected in the tipping point: The tipping point moves from Florida, where Clinton led by 0.8%, to Michigan where Rubio is now ahead by 0.9%. Clinton vs Rubio remains a very close race. But Rubio now has a small advantage. Others Clinton vs Kasich is neither a front-running pair, or in the top five best polled combinations, so I won’t consider it fully here other than to note that the latest New Hampshire poll moved Kasich into the lead, changing his expected case from losing to Clinton by 46 electoral votes, to losing to Clinton by 38 electoral votes. 252.2 days until polls start to close on Election 2016. Note: This post is an update based on the data on ElectionGraphs.com. Election Graphs tracks both a poll based estimate of the Electoral College and a numbers based look at the Delegate Races. All of the charts and graphs seen in this post are from that site. Additional graphs, charts and raw data can be found there. All charts above are clickable to go to the current version of the detail page the chart is from, which may contain more up to date information than the snapshots on this page, which were current as of the time of this post. Follow @ElectionGraphs on Twitter or like Election Graphs on Facebook to see announcements of updates or to join the conversation. For those interested in individual general election poll updates, follow @ElecCollPolls on Twitter for all the polls as they are added.
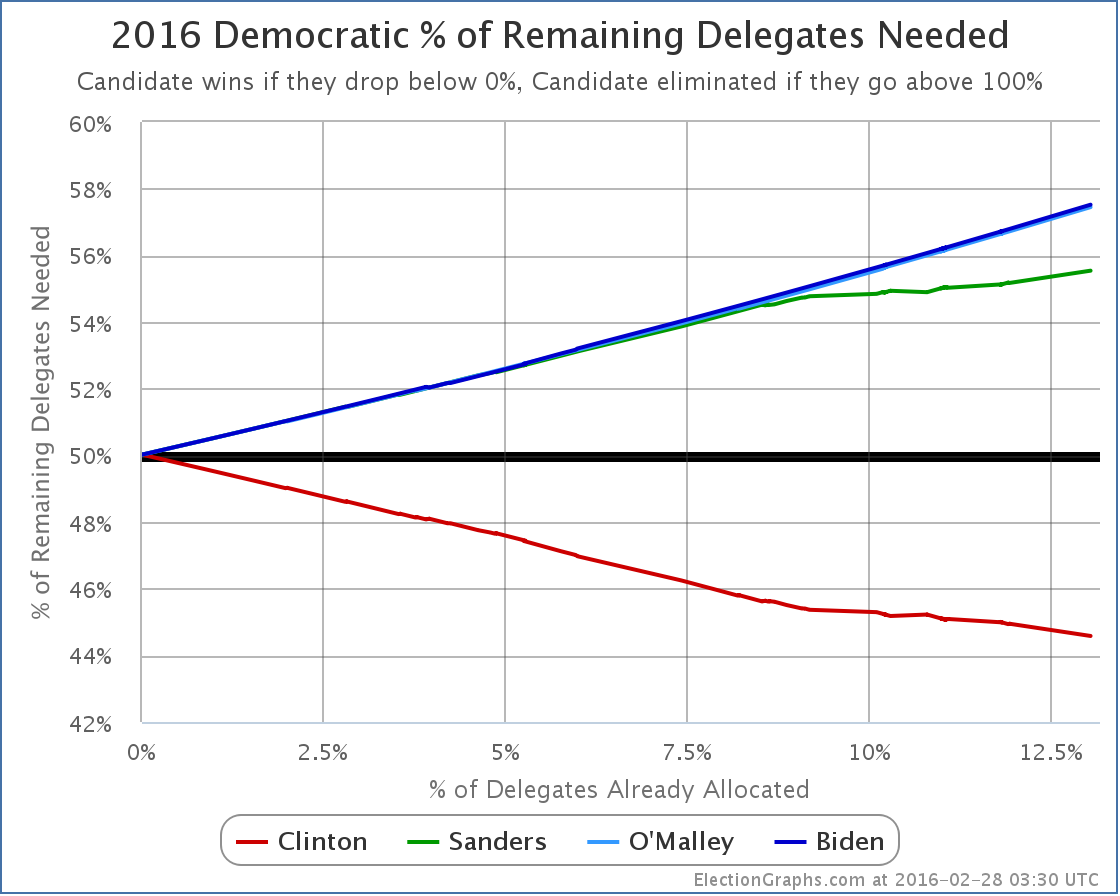
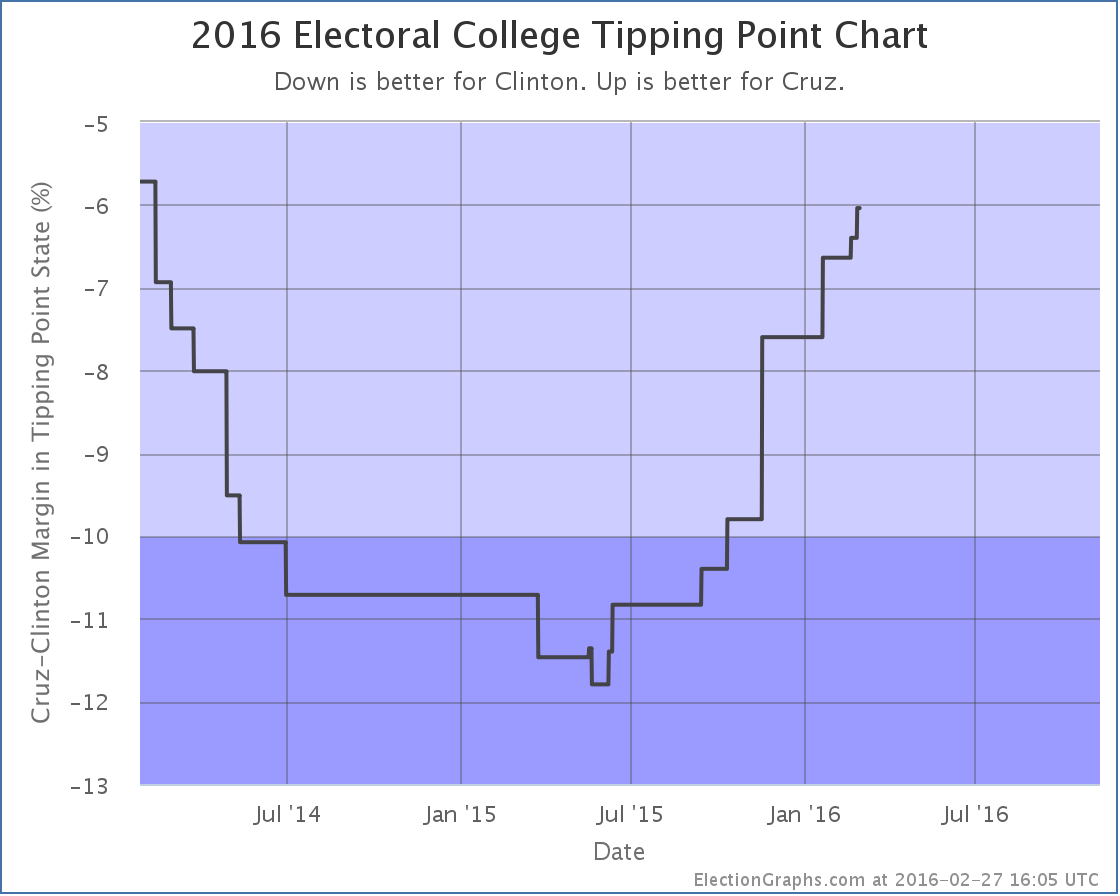
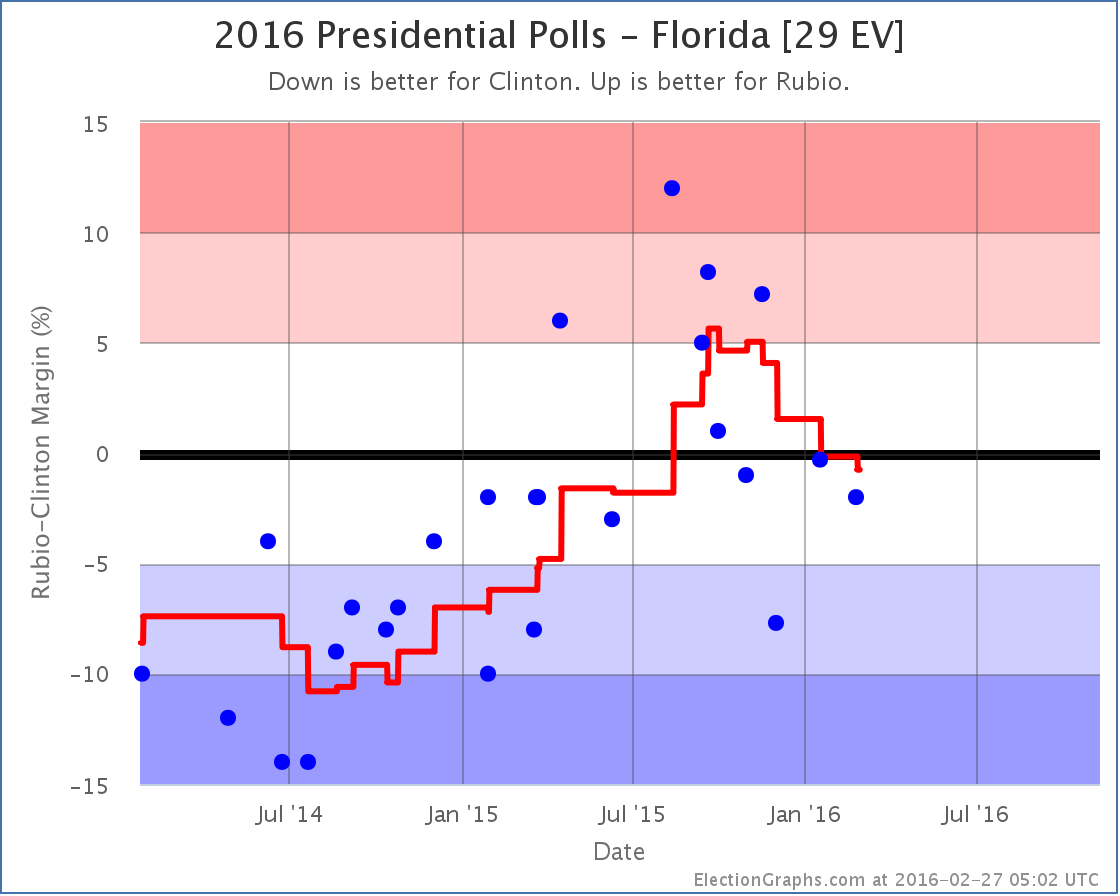
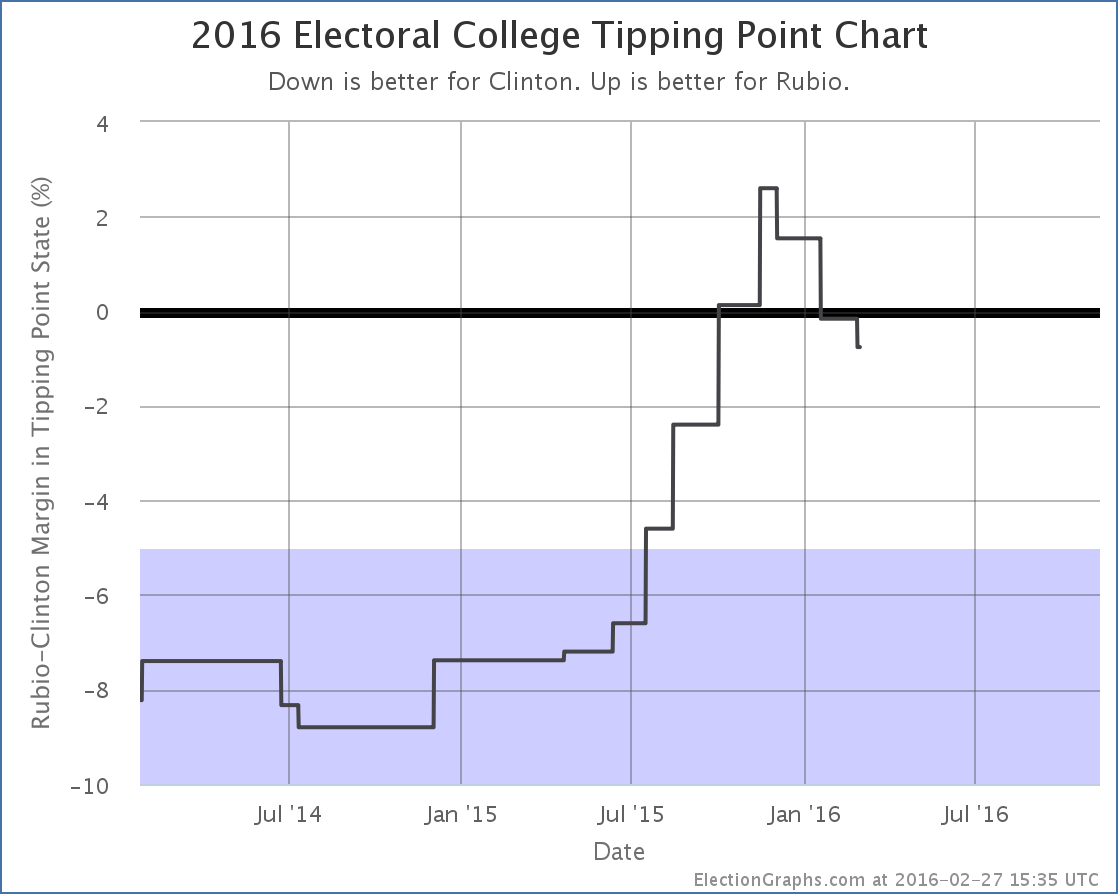
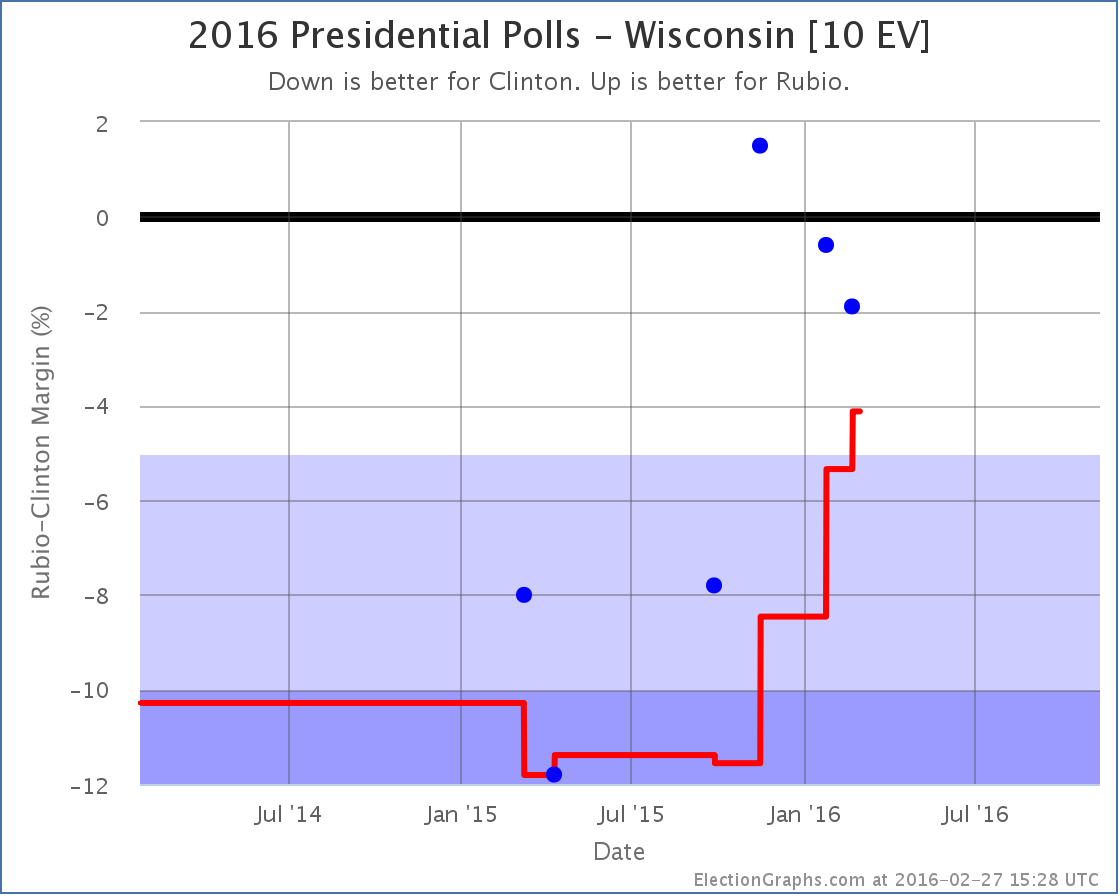
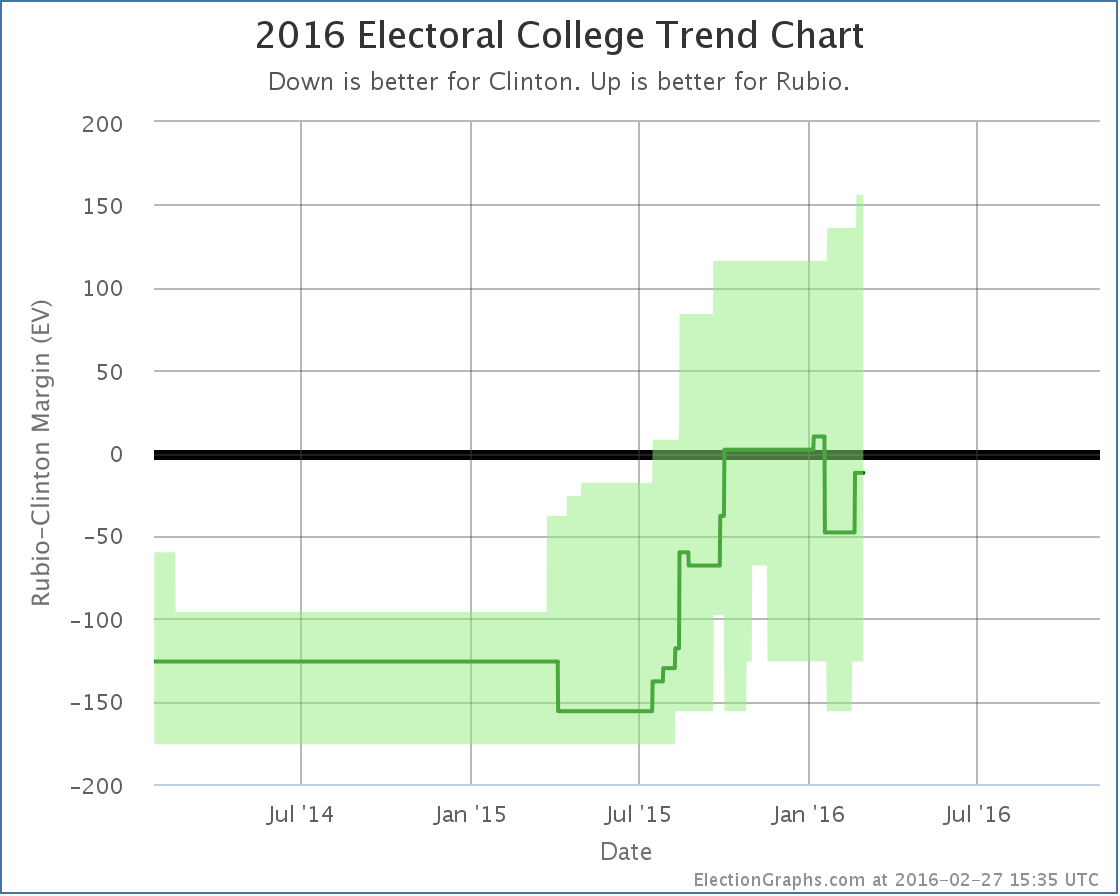
As expected, Clinton easily won South Carolina. Clinton won 39 delegates, Sanders got 14. Since my last post on the Democrats the tally has also added a net 10 superdelegates for Clinton, 1 for Sanders, and 1 straggler for O’Malley. As of that last post, Sanders needed to get more than 55.03% of delegates to be on track to catch up with Clinton and win. Obviously that hasn’t happened with these updates. He got 23.08% of the delegates since that post. So the end result is that the percentage of the remaining delegates Sanders needs to win goes up, while that number for Clinton goes down: South Carolina is that slight acceleration of the curves starting at about 11.9%. Sanders now needs 55.54% of the remaining delegates to catch up and win. (Or less if he starts flipping Clinton superdelegates to his side, but there has been no sign of that yet.) Meanwhile, Clinton only needs 44.58% of the remaining delegates to win. Frankly, in the 2008 and 2012 cycles once the frontrunner needed less than 45% of the delegates to win, it was time to start calling the race over. Yes, something happening that would allow a challenger to catch up and win is still possible. But it is unlikely. And with each additional contest where the challenger fails to make their own “% needed to win” mark, it gets harder. But lets not consider it done quite yet. Super Tuesday is coming up in a few days. Maybe there is something there to indicate this isn’t over quite yet. Just as I did for the Republicans, lets game out what Super Tuesday looks like based on current polling. I’ll use the RCP poll averages, then try to estimate delegates based on the rules in each state. Texas (222 delegates)
Georgia (102 delegates)
Virginia (95 delegates)
Massachusetts (91 delegates)
Minnesota (77 delegates)
Tennessee (67 delegates)
Colorado (66 delegates)
Alabama (53 delegates)
Oklahoma (38 delegates)
Arkansas (32 delegates)
Vermont (16 delegates)
Democrats Abroad (13 delegates)
American Samoa (6 delegates)
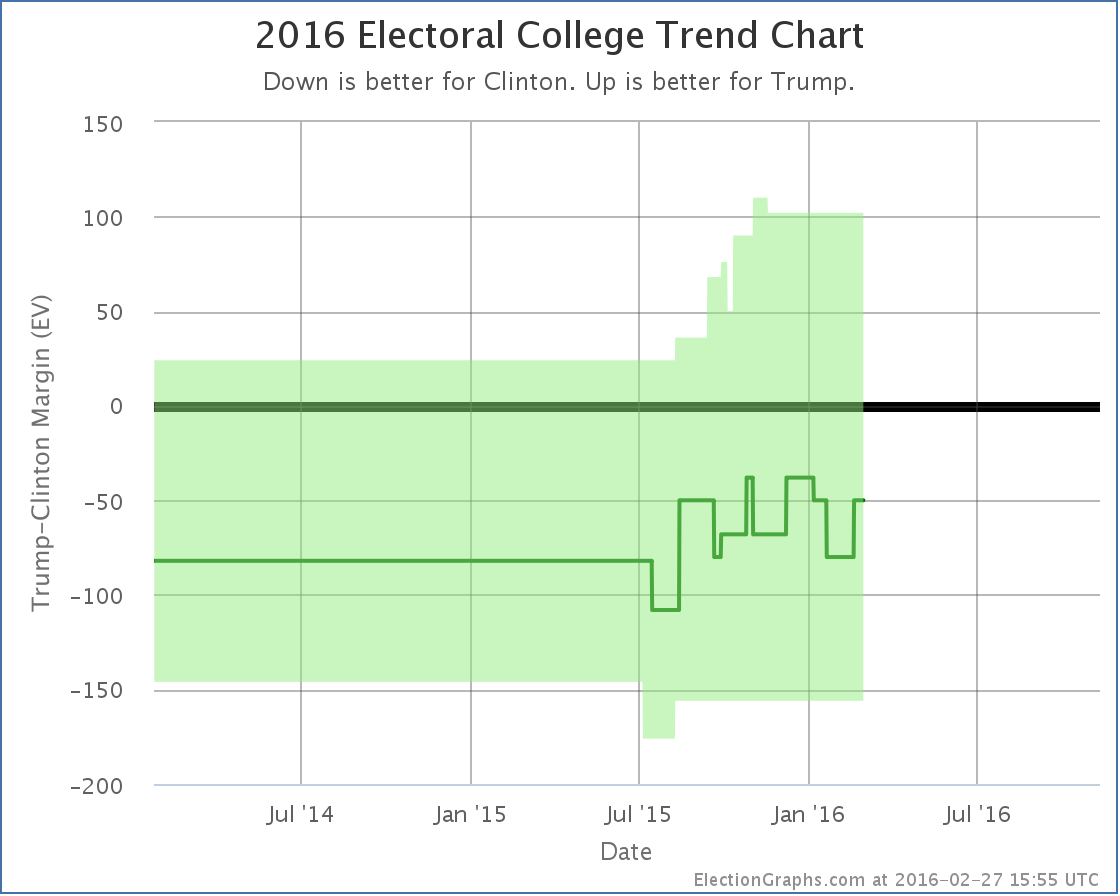
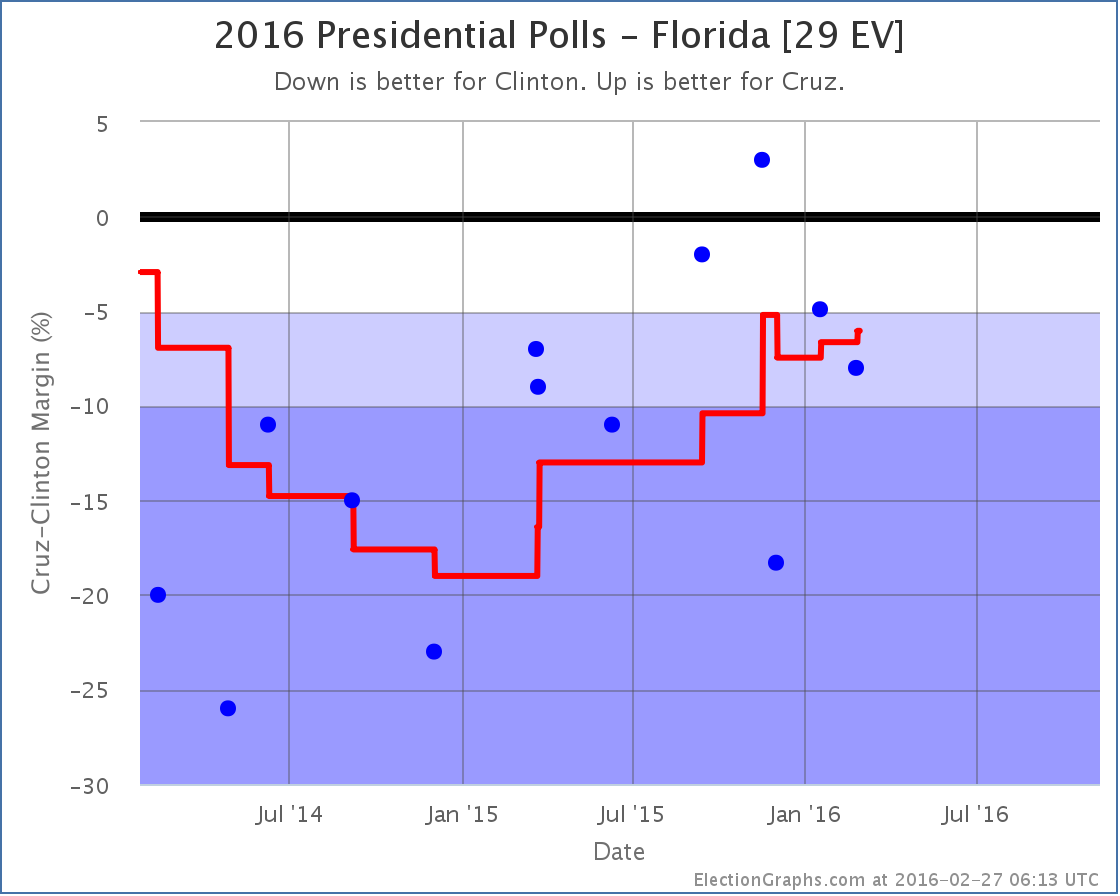
OK. Adding all those up… 533 Clinton, 345 Sanders Now, these are estimates based on relatively sparse polling and the assumption that candidate support is uniformly distributed within each state. The results will not be exactly like this. But unless something major happens to change the picture in the next couple of days, the results on Tuesday should look broadly similar to this. With the estimate above, Sanders gets about 39.3% of the delegates. A far cry from the 55.5% he would need in order to actually improve his position against Clinton. Adding the current delegates to the estimated Super Tuesday delegates, the new totals would be: 1,069 Clinton, 427 Sanders, 3 O’Malley 31.5% of the delegates will have been allocated. But 68.5% would still be available. What would Sanders’ new “% of remaining needed to win” be at that point? It would be 59.9%. Sanders would need nearly 60% of the remaining delegates to catch up and win, or a massive defection of Clinton superdelegates to lower that number. To imagine Sanders performing like this, you either have to believe the remaining states are vastly different in their preferences to the states that will have gone before (there is no evidence for this so far), or some massive seismic event would have to happen in the campaign to dramatically change minds of large numbers of Democratic voters in a very short timeframe. A good argument could be made that absent a shocking surprise, this race is already done. After Super Tuesday, if the results are anything like the estimates above, then those hoping for a Sanders win will be grasping at the thinnest of straws. By the time we get to the end of March, again, absent that huge surprise, there will be no serious question any more. Now, surprises do sometimes happen. You never know. But you don’t get to a Sanders win from here with just “normal” campaigning. It would take something bigger… a major Clinton scandal bigger than anything seen so far… a serious issue with Clinton’s health… something along those lines. This doesn’t preclude Sanders staying in the race all the way until the convention and battling in every primary and caucus. He could do that if his cash flow holds out. But it would be to champion his issues and to try to move the party further in his direction, it would not be a serious attempt to win the nomination. Three days from the time I post this, we’ll have Super Tuesday results and we’ll see just how close my poll based guestimates were and if this analysis holds up. More then… [Update 2016-03-02 00:47 UTC – As a result of a final scan for superdelegates prior to adding Super Tuesday results we have a net change of +7 Clinton superdelegates, +2 Sanders superdelegates, -2 O’Malley superdelegates (they flipped to Clinton). This does not substantively change any of the analysis above and does not get a separate blog post, but a note here was warranted.] Note: This post is an update based on the data on ElectionGraphs.com. Election Graphs tracks both a poll based estimate of the Electoral College and a numbers based look at the Delegate Races. All of the charts and graphs seen in this post are from that site. Additional graphs, charts and raw data can be found there. All charts above are clickable to go to the current version of the detail page the chart is from, which may contain more up to date information than the snapshots on this page, which were current as of the time of this post. Follow @ElectionGraphs on Twitter or like Election Graphs on Facebook to see announcements of updates or to join the conversation. For those interested in individual general election poll updates, follow @ElecCollPolls on Twitter for all the polls as they are added. Yes, all the attention is on South Carolina and Super Tuesday, but time for a quick electoral college update from recent poll updates. In the last batch of polls were new matchup results in Florida, Georgia, Wisconsin and West Virginia. These resulted in a few notable changes. Clinton vs Trump Well, actually, once again there was no significant update in the Clinton vs Trump race, but in this transitional phase where we are still getting polling for folks other than the frontrunners, I’ll mention the frontrunner status when there is a post highlighting changes with other candidate pairs. Trump’s lead in the average in Georgia actually dropped from 10.1% to 9.5% changing Georgia from “Solid Trump” to “Strong Trump” in my categorization, but this really doesn’t make any difference. Georgia isn’t in play at the moment. The situation remains that anything from Clinton winning by 156 to Trump winning by 102 is within the realm of the possible, and Clinton winning by 50 is the “expected” result if all the states go where their averages are currently pointing. Clinton vs Cruz Cruz improves a bit in Florida against Clinton, but not enough to change categories. Florida was however the tipping point state, so this also moves: Cruz’s upward tipping point trend continues. Just a little bit further, and the Clinton vs Cruz race might actually look competitive! (Reminder, the tipping point represents the margin in the state that would put the winner “over the top” if you ranked the states by their candidate preference. It is a good measure of how much the candidate who is behind would have to change national public opinion to flip the result and win.) Clinton vs Rubio This matchup had notable changes caused by the polls in two different states. First up, Florida: The state didn’t change status. It was “Weak Clinton” before, and remains “Weak Clinton”. But as with Cruz, Florida was the tipping point state, and so the tipping point changes as well. By this metric Rubio peaked in November and has been declining ever since. A Clinton vs Rubio matchup still looks incredibly close though. Clinton is only ahead here by 0.8%. So this was good for Clinton. But there was also a change in Wisconsin that was good for Rubio: All the recent polls have shown Wisconsin as a close state, whereas older polls had it Strong or Solid Clinton, and therefore the average has been moving up toward Rubio. With today’s update, it moves from “Strong Clinton” to “Weak Clinton”. This puts it in play for Rubio and improves his best case: There are now ELEVEN close states in the Clinton vs Rubio contest, accounting for 141 electoral votes, which is quite a swing! Everything from Clinton by 126 to Rubio by 156 is now “in the bubble”. Clinton remains a slight favorite, winning by 12 electoral votes if all the states ended up following current poll results. But this is a tiny margin. Clinton vs Rubio remains essentially a tied race, with Florida’s 29 electoral votes at the tipping point. And that is where things stand at the end of February. 254.9 days left until general election polls start to close. Note: This post is an update based on the data on ElectionGraphs.com. Election Graphs tracks both a poll based estimate of the Electoral College and a numbers based look at the Delegate Races. All of the charts and graphs seen in this post are from that site. Additional graphs, charts and raw data can be found there. All charts above are clickable to go to the current version of the detail page the chart is from, which may contain more up to date information than the snapshots on this page, which were current as of the time of this post. Follow @ElectionGraphs on Twitter or like Election Graphs on Facebook to see announcements of updates or to join the conversation. For those interested in individual general election poll updates, follow @ElecCollPolls on Twitter for all the polls as they are added.
|
||
