- 02:20:18 Democratic update in Colorado from state convention: Sanders +2, Clinton -2 https://t.co/VCq2EHJXd7
- 14:19:22 Democratic superdelegate update: Sanders +1, Clinton -1. https://t.co/VCq2EHJXd7
- 15:53:28 [Blog Post] Republicans: Trump whiffs in Wyoming too, but New York is coming https://t.co/ywUggNNOKP
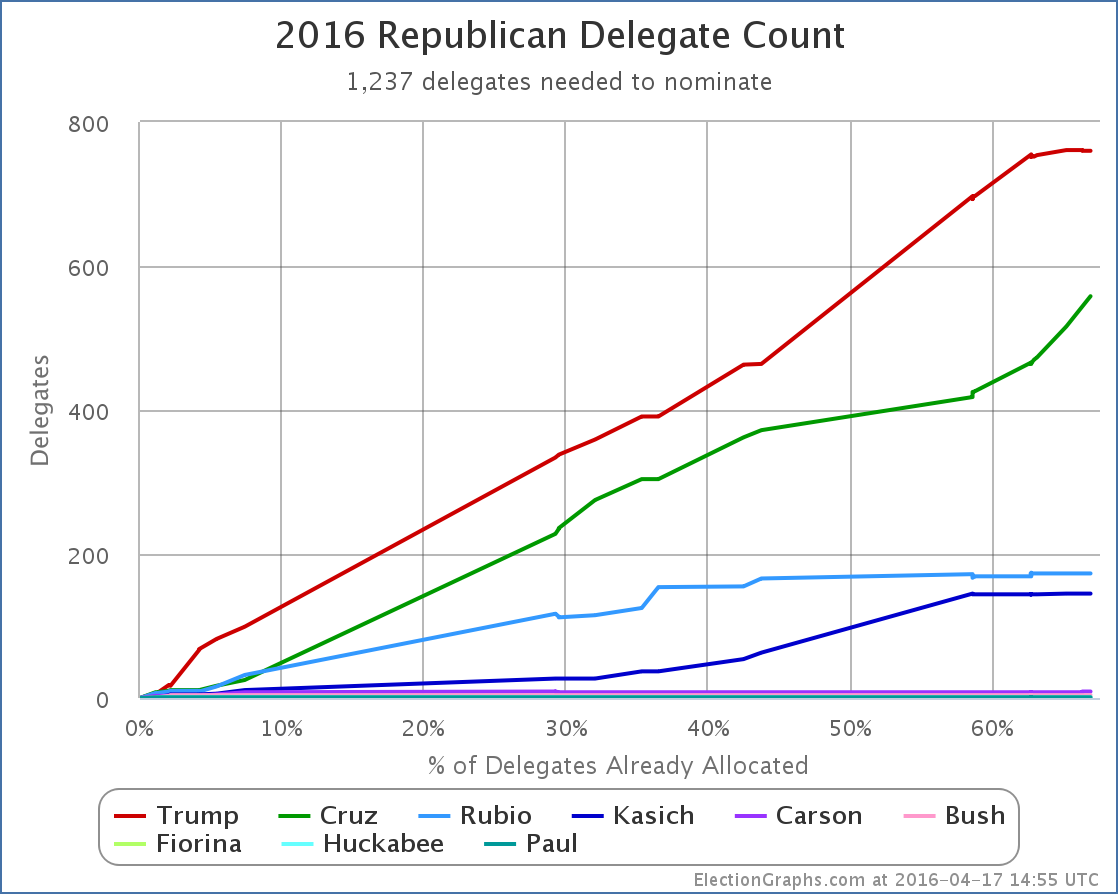
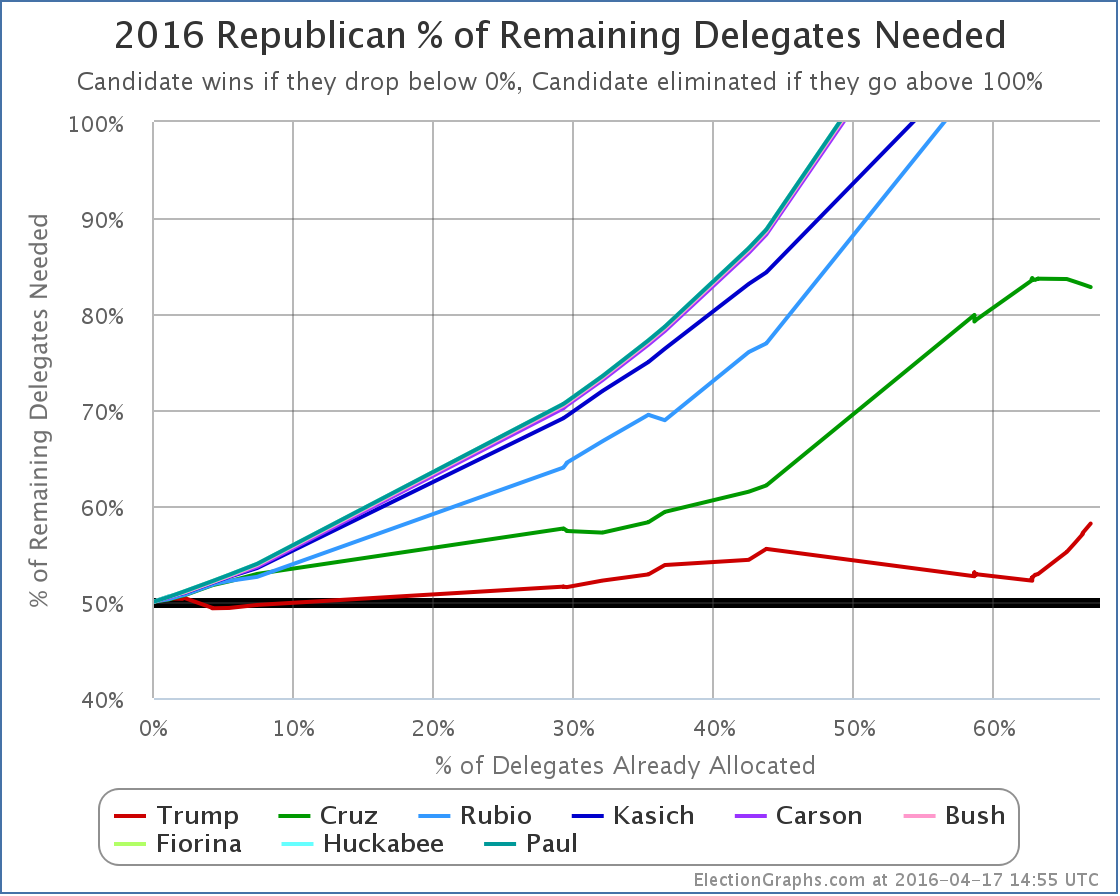
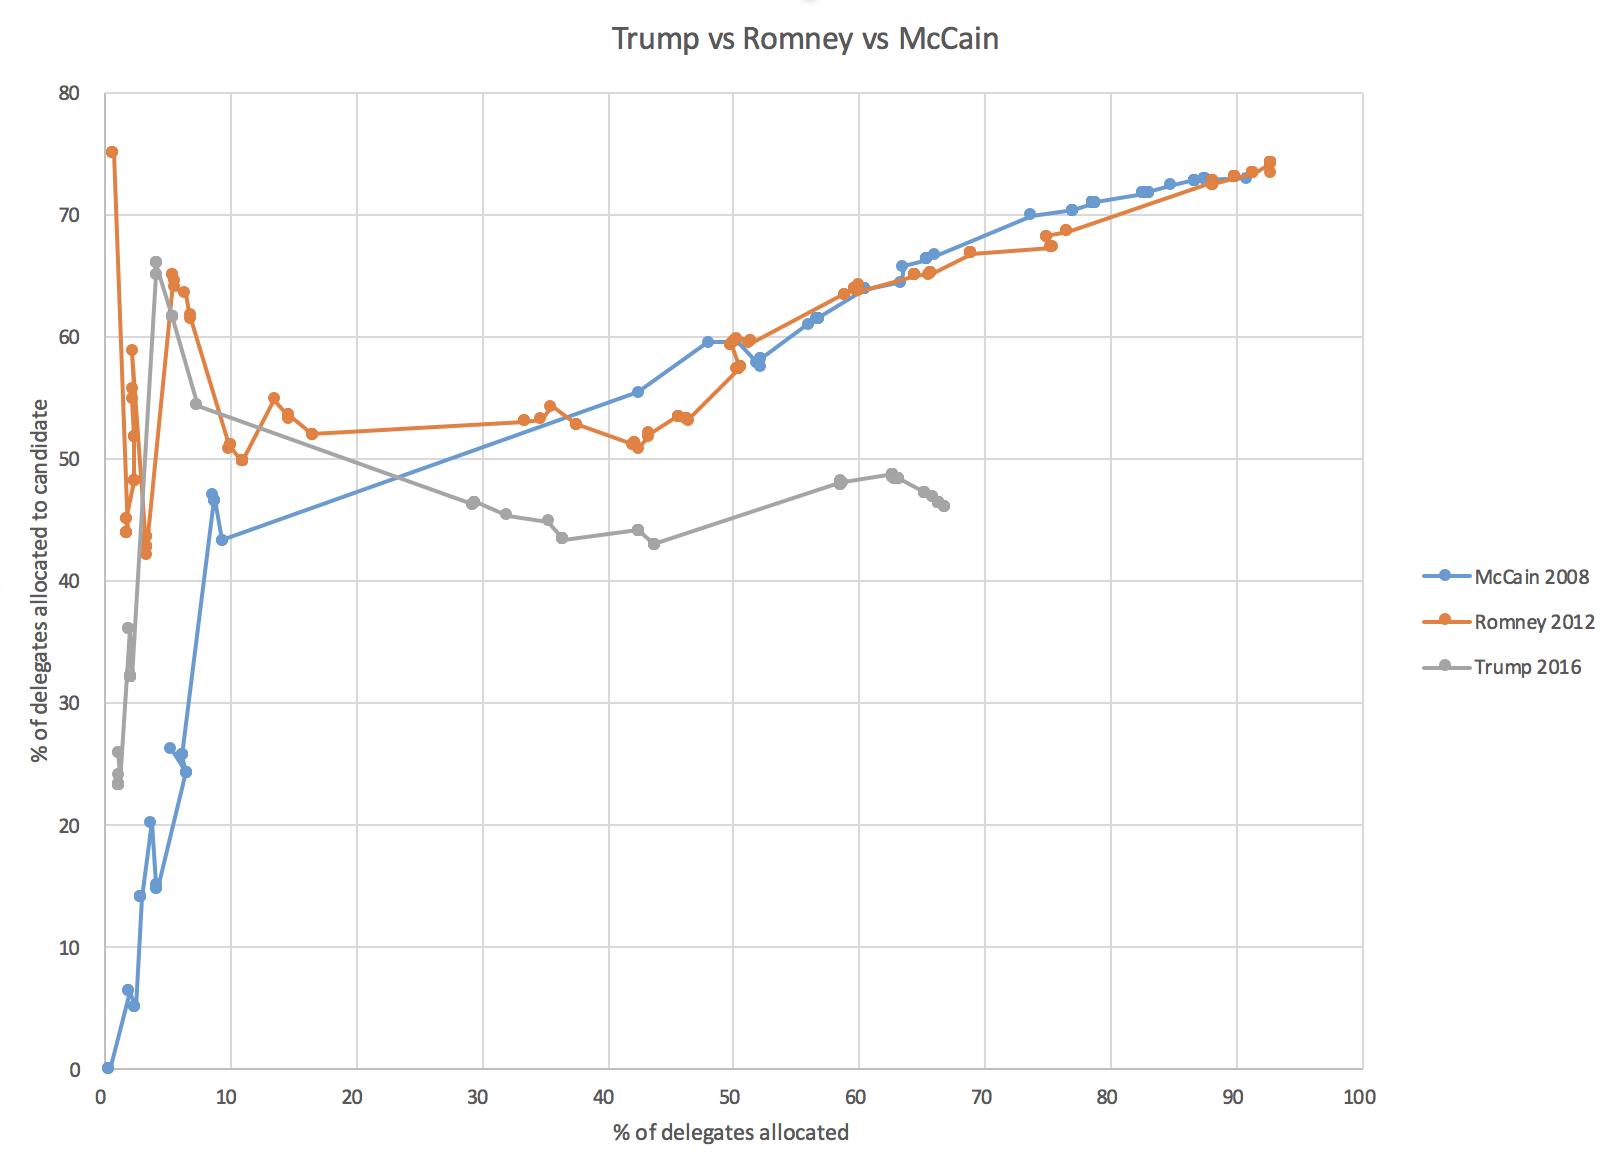
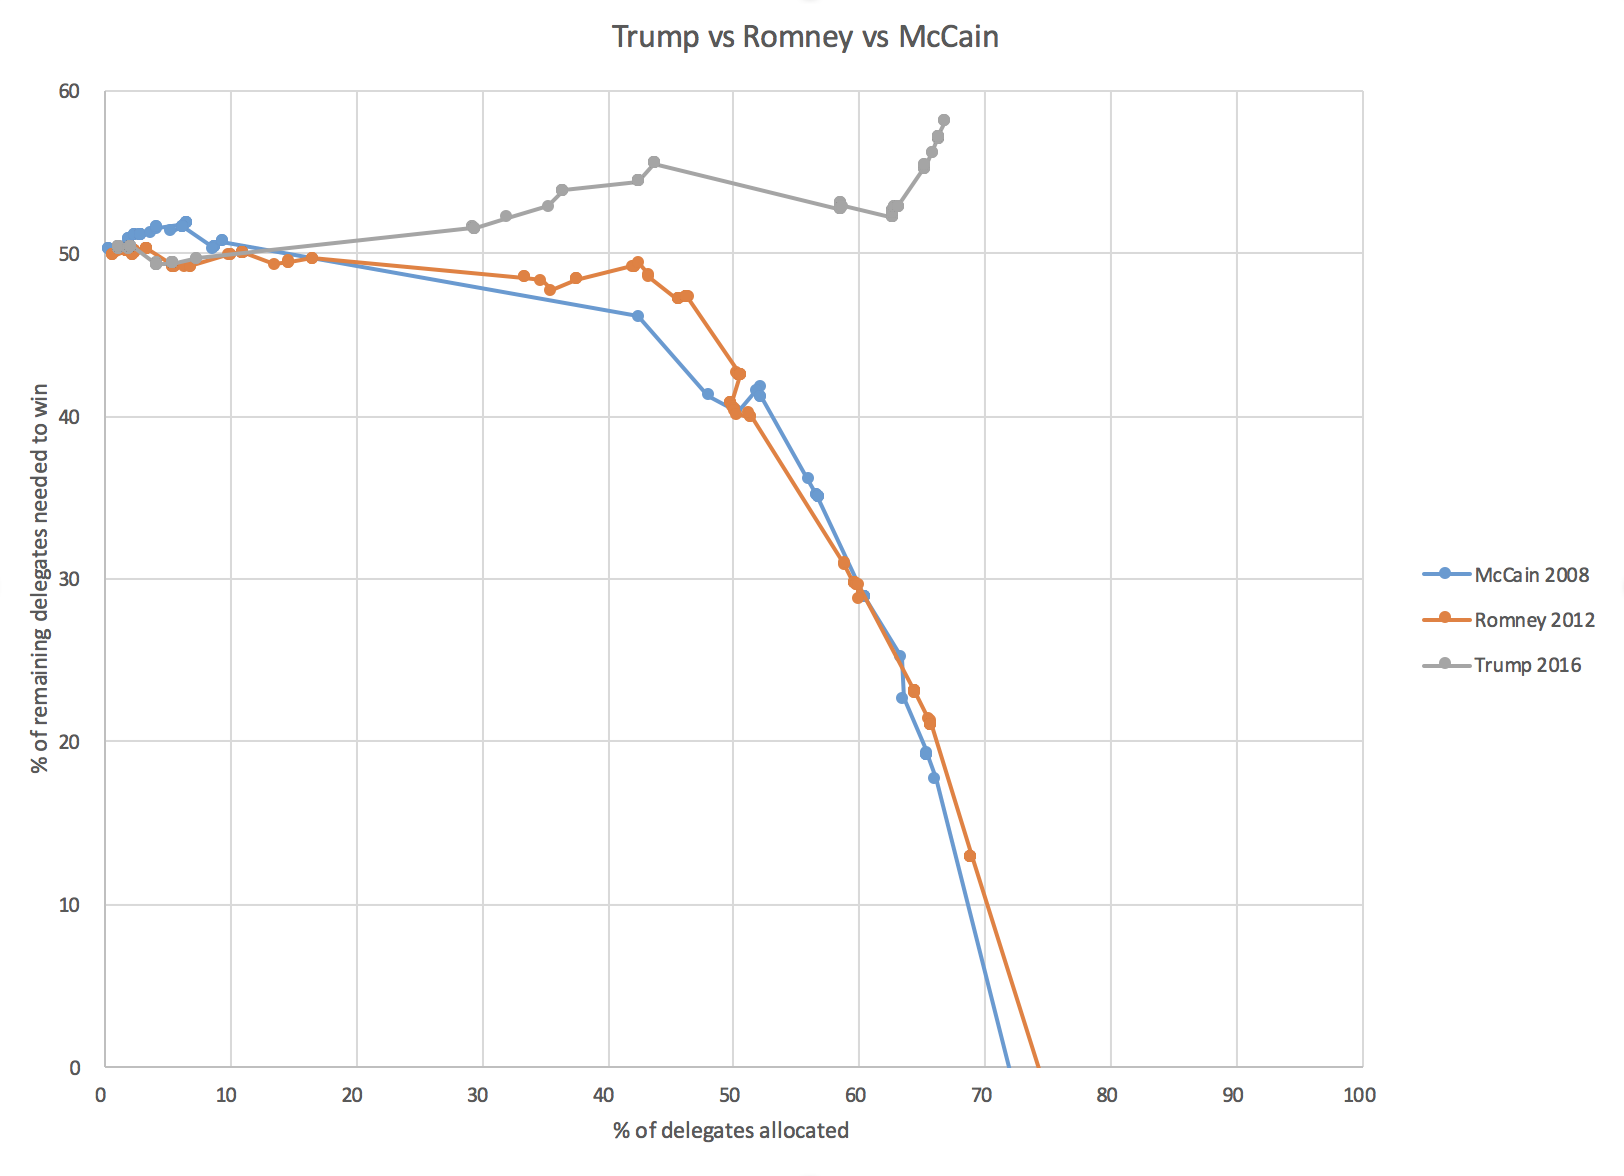
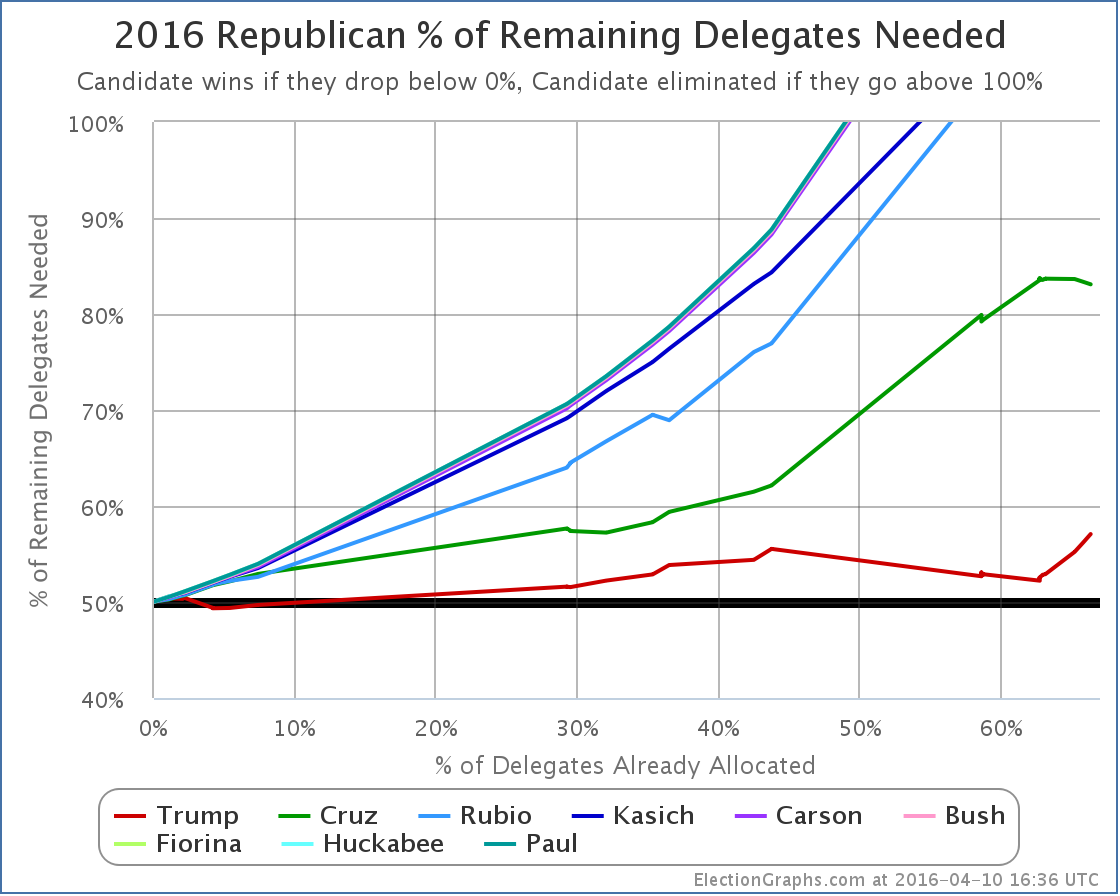
Wyoming allocated delegates in a two stage process. 12 were determined back on March 12th. At that point the count was Cruz 9, Rubio 1, Trump 1. One uncommitted delegate was elected as well. He appears to still be uncommitted. On April 16th Wyoming completed their process, allocating their remaining 14 “normal” delegates at their state convention. All 14 delegates went to Cruz. There are three more delegate slots for party leaders. They have not yet expressed their preferences. This once again appears to be a case of the Trump team not even bothering to “play” in Wyoming and just letting Cruz clean up essentially unopposed. This in a race where Trump needs every delegate. In addition, since my last post there was an update in North Carolina that resulted in moving one delegate from the Trump column to the Carson column of all places. So the net change in the last week is Cruz +14, Carson +1, Trump -1. This obviously represents less than the 57.07% of delegates Trump needed to be on pace for a win. Time to look at some charts: Looking at the raw delegate count, Cruz looks like he is catching up quickly. And he has been doing extremely well recently. But there is a problem. It is very late in the process. Cruz’s win streak has succeeded in lowering his % of remaining delegates needed to win, but not by a lot. It has dropped from 83.68% to 82.80%. This is still a number that Cruz can not realistically reach. So Trump. His 57.07% increased to 58.17%. New York is next. Trump is expected to do very well in New York. But the specific line to watch is the 58.17% line. Translated into delegates, this means to be on track to get to a delegate majority, he needs at least 56 of the 95 delegates. The expectation seems to be that he will exceed this bar, probably by a significant margin. Even if Trump got all 95 delegates though, it still wouldn’t completely undo the damage of Cruz’s winning streak. In that case Trump would need 52.69% of the remaining delegates. Trump had been down to 52.22% before his string of losses. So shutting everybody out in New York wouldn’t quite get him back there. Close though. After New York, there are quite a few more states where Trump is expected to do very well and some of them are winner take all. We’re still right on the edge between an outright Trump win and a contested convention. Anybody who says either of those two outcomes is certain at this point is premature. We’ll see what happens in New York shortly, and the “narrative” of the race will almost certainly turn again. In the meantime, let me update the comparisons to 2008 and 2012 that I did back on March 13th. First of all just the % of delegates won: Then the more important “% of remaining delegates needed to win”: It is still possible for Trump to win outright. Barely. But it is very very clear that his path is dramatically different than the McCain or Romney patterns. In both of those cases, by this point the frontrunners were clearly the presumptive nominees, even though they hadn’t quite wrapped it up mathematically yet. This year Trump still has a minority of the delegates, and he hadn’t even been trending in the right direction. We’re not in the “wrapping things up” stage, instead, we clearly still have a fight going on. Which of course makes this all much more fun to watch than 2008 or 2012 were. :-) [Update 2016-04-20 01:27 UTC: New delegate estimate from Georgia nets Cruz +1, Trump -1. This does not change the analysis above.] Note: This post is an update based on the data on ElectionGraphs.com. Election Graphs tracks both a poll based estimate of the Electoral College and a numbers based look at the Delegate Races. All of the charts and graphs seen in this post are from that site. Additional graphs, charts and raw data can be found there. All charts above are clickable to go to the current version of the detail page the chart is from, which may contain more up to date information than the snapshots on this page, which were current as of the time of this post. Follow @ElectionGraphs on Twitter or like Election Graphs on Facebook to see announcements of updates or to join the conversation. For those interested in individual general election poll updates, follow @ElecCollPolls on Twitter for all the polls as they are added.
Colorado is odd in that it dribbled out delegates over a couple of weeks. The 6 from the 1st and 6th congressional districts were already included when the Michigan results came out. Those 6 were all Cruz. Since then I added notes about the rest of Colorado’s congressional districts to the Michigan post. Cruz won all 15 of those delegates. Then yesterday Cruz won all 13 at large delegates. There are 3 more delegates from Colorado who are state party leaders and have not yet expressed a preference. But Cruz has won all 34 of Colorado’s delegates that were available via the caucus process. Since March 23rd, Trump has gotten bad news in Alaska, American Samoa, Louisiana, North Dakota, Wisconsin and Colorado. Some of those were “new” results in states, others were just updates as more information came in. Either way, none of those updates went Trump’s way. Lets look at the chart: After Arizona and Utah Trump needed 52.22% of the remaining delegates to be on a winning pace. Since then the delegate deltas have been Cruz +78, Trump +6, Rubio +4, Kasich +1. And that Kasich delegate is being generous interpreting one uncommitted delegate’s comments. That might actually be a Cruz delegate in the end. So Cruz got 78/89 = 87.6% of the delegates. Trump got 6/89 = 6.7% of the delegates. Needless to say this is far below the 52.22% Trump needed to improve his position. Instead, he goes from needing 52.22% of the remaining delegates to needing 57.07%. This is huge change. Winning 57.07% of the delegates would represent a 23% improvement over the 46.46% of delegates pace he has so far. That is a pretty substantial improvement. Trump is in the worst position he has been so far. This is not where he wants to be. Everything is going in the wrong direction. But is it time to assume a contested convention yet? The drum beat about that has certainly begun. I could do my usual of calculating an estimate for New York from current polling, and then look where that puts us, but other folks have done more in depth projections. I’ll specifically point out two:
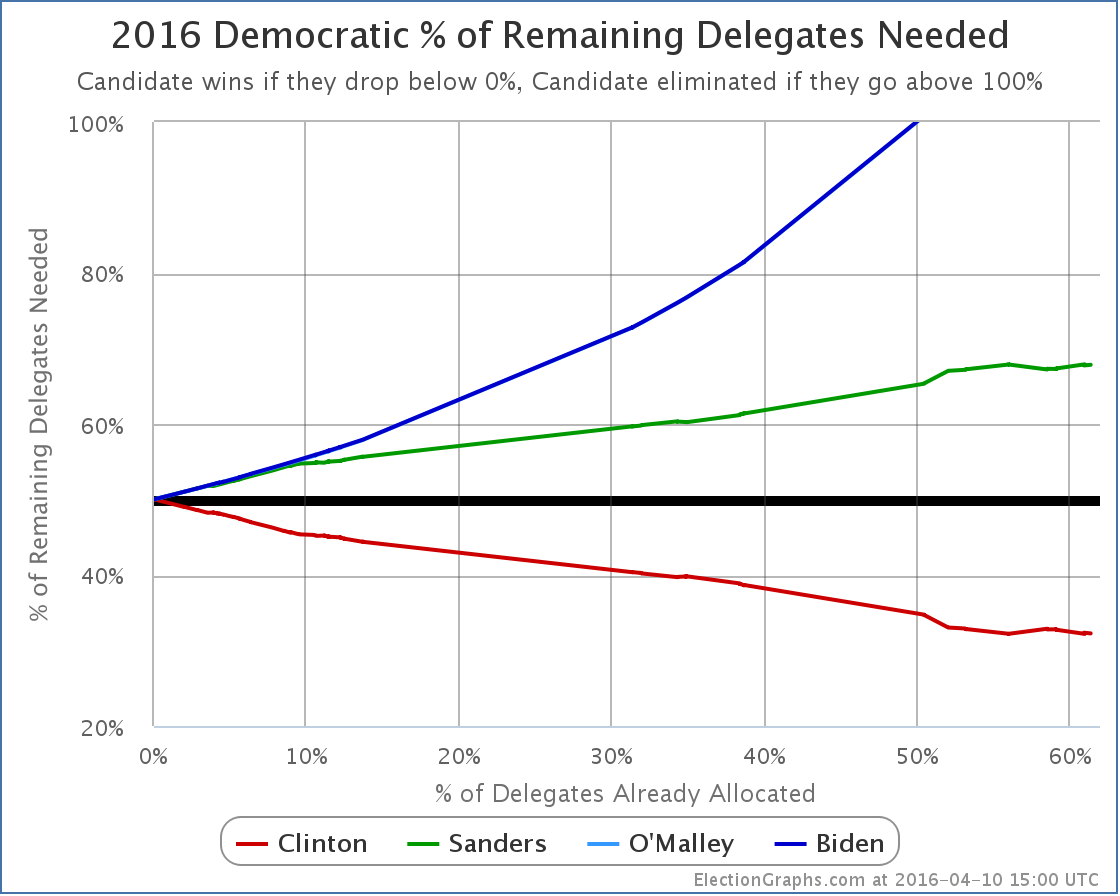
Both of these two outline scenarios where Trump can still get to 1237. These are not highly unlikely scenarios like those required to get to a Sanders win on the Democratic side, but rather perfectly reasonable possibilities given current polling data. Trusting current polls completely, Wang actually gets a 92% chance of Trump getting the delegate majority. When he adjusts for the fact Cruz has been over performing his polls, that drops to 70%. This is by no means certain, but it is still more likely than not. In addition you can run your own simulations at The Upshot or FiveThirtyEight. With either of these it is not that hard to get Trump to 1237. Try it yourself. It is fun. My own take is that some of Wang’s assumptions about how uncommitted delegates will break is a bit generous to Trump given his performance so far with uncommitted and unbound delegates. So 70% chance of an outright majority seems a bit high. In the last Curmudgeon’s Corner podcast I said my gut feel was that we have a 60% chance of a multiple-ballot convention at this point. Which would mean a 40% chance that Trump wins outright. (I allowed for some additional chance of convention shenanigans like trying to change the rules to unbind delegates on the first ballot, or that the results of there 1st ballot would be unclear until the actual vote due to uncommitted delegates.) Trump was EXPECTED to do badly in Colorado and Michigan… perhaps not quite this badly, but still it means that it is easy to get distracted by notions of “momentum” that may or may not be real. The fact that Trump did well in Arizona, but then badly in Colorado does not represent a change in the state of the race. It is just a function of the makeup of those states and the calendar. To see if things have really changed from being “right on the edge between a Trump win and a contested convention” we need to see deviations against how the remaining states are expected to play out. We haven’t seen that quite yet. But all the anti-Trump forces are pushing against him hard and Trump has no margin for error in the remaining states. He has to do well in all the places he is expected to do well. He might actually need to exceed expectations by a bit. If he starts dipping, even a little bit, then we are at a contested convention. And given what appears to be Cruz’s skill at collecting “ghost delegates” who are bound to Trump on the first ballot but who really support Cruz, a Trump loss on the first ballot almost certainly means Cruz (or maybe someone else, but probably Cruz) wins on a later ballot. Keep watching New York and if Trump stays over 50% in the popular vote, which will get him all or almost all of the delegates. That is the next big test. If Trump underperforms expectations in New York, we almost certainly will have a multi-ballot convention. If he matches or exceeds expectations, then the path to an outright Trump win remains open. [Update 2016-04-13 15:19 UTC: Update from North Carolina. Net Change: Carson +1, Trump -1.] Note: This post is an update based on the data on ElectionGraphs.com. Election Graphs tracks both a poll based estimate of the Electoral College and a numbers based look at the Delegate Races. All of the charts and graphs seen in this post are from that site. Additional graphs, charts and raw data can be found there. All charts above are clickable to go to the current version of the detail page the chart is from, which may contain more up to date information than the snapshots on this page, which were current as of the time of this post. Follow @ElectionGraphs on Twitter or like Election Graphs on Facebook to see announcements of updates or to join the conversation. For those interested in individual general election poll updates, follow @ElecCollPolls on Twitter for all the polls as they are added. Clinton and Sanders left the Wyoming caucuses with a 7 to 7 delegate tie. In the mean time, since Wisconsin Sanders has been winning the superdelegate race. The net change over that time has been Sanders +7, Clinton +2. This actually includes one delegate that actually did indeed switch from Clinton to Sanders (with a couple days as uncommitted in between). So far, that has been a very rare event. Perhaps it is the beginning of a trend? If so, I will of course note it here. Adding up the changes since Wisconsin, we get Sanders +14, Clinton +9. This means Sanders has gotten an impressive 60.87% of recent delegates… …which is not enough. Sanders needed to get better than 67.76% of the delegates to be on pace to catch up and win. The percentage of the remaining delegates Sanders needs to win is now 67.84%. There have been some ups and downs, but basically Sanders had been able to keep things at 67.xx% since March 17th. This represents Sanders’ string of wins. Those wins have prevented Sanders’ situation from getting much worse, but critically he has not succeeded in actually bending his line downward to start heading to an actual win. Clinton only needs 32.27% of the remaining delegates (including superdelegates) in order to win. This is not a high bar. To be absolutely clear here, this means Sanders could win every remaining contest by an absolutely stunning margin… and Clinton would still win the nomination because it wouldn’t be enough to catch up. Of course, the Sanders argument is that if he did indeed continue winning almost every contest, the superdelegates would finally start coming to his side in large numbers, and would change those dynamics. Maybe. He has to actually do that first. And make sure that his efforts to sway the superdelegates don’t backfire and make them even more strongly committed to Clinton than they were before. New York is up next of course. Clinton is currently leading the RCP poll average there by 14%. There are 247 delegates at stake. If the delegates in New York split according to current polls, then as a rough estimate Clinton will get 142 delegates and Sanders will get 105. That would leave Sanders needing 71.76% of the remaining delegates to catch up, and Clinton only needing 28.37% to get to the magic number and wrap things up. The Sanders folks are tenacious, but actually winning the nomination would still take something catastrophic happening to Clinton’s campaign. The reason for Sanders to continue at this point is primarily to influence Clinton and pull her toward Sanders’ positions presumably. Unless the Sanders camp really is just hoping that Clinton will indeed implode at some point. We will see. [Update 2016-04-13 15:08 UTC – Superdelegate scan nets Clinton +4, Sanders +1. In addition an adjustment from Colorado yields Sanders +1, Clinton -1. Net for today’s changes, Clinton +3, Sanders +2.] [Update 2016-04-17 02:20 UTC – Update from Colorado Democratic State Convention today. Net change: Sanders +2, Clinton -2.] [Update 2016-04-17 14:19 UTC – Superdelegate scan nets Sanders +1, Clinton -1.] [Update 2016-04-20 01:20 UTC – Superdelegate scan net: Clinton -2.] Note: This post is an update based on the data on ElectionGraphs.com. Election Graphs tracks both a poll based estimate of the Electoral College and a numbers based look at the Delegate Races. All of the charts and graphs seen in this post are from that site. Additional graphs, charts and raw data can be found there. All charts above are clickable to go to the current version of the detail page the chart is from, which may contain more up to date information than the snapshots on this page, which were current as of the time of this post. Follow @ElectionGraphs on Twitter or like Election Graphs on Facebook to see announcements of updates or to join the conversation. For those interested in individual general election poll updates, follow @ElecCollPolls on Twitter for all the polls as they are added. |
||
