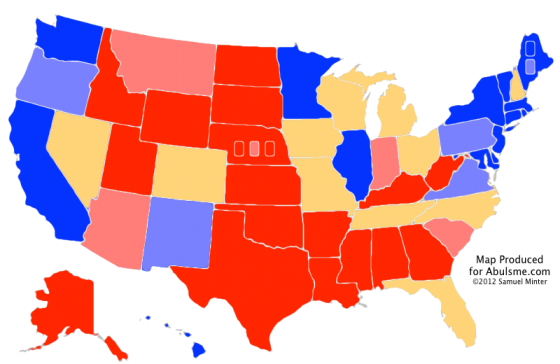
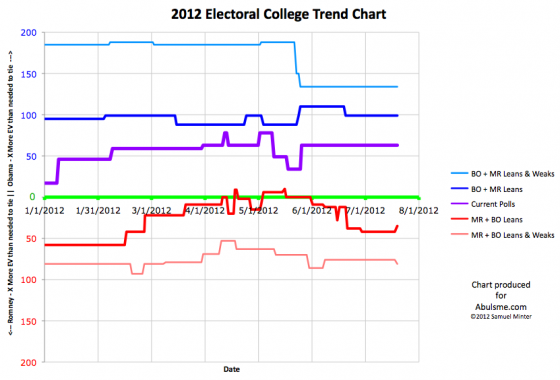
Chart and map from the Abulsme.com 2012 Electoral College Prediction page. Both assume Obama vs Romney with no strong third party candidate. Both show polling as it currently exists. Things will change before election day. On the map red is Romney, blue is Obama, gold states are too close to call. Lines on the chart represent how many more electoral votes a candidate would have than is needed to tie under several different scenarios. Up is good for Obama, Down is good for Romney.
We haven’t had an update to the status of any state in my model since June 29th. This is the longest stretch without an update since I started tracking this year’s electoral college race at the end of January. Now, the July 4th holiday was in the middle of that, and so polling was sparse for awhile, but still, there were plenty of polls, they just didn’t actually move states into new categories. Until today. We finally get three states moving today. Two move in Romney’s direction, one moves toward Obama.
So, in order by electoral weight:
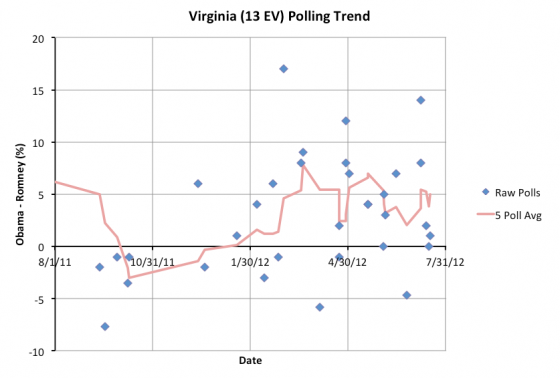
I added three new polls to the database for Virginia (13 ev) today and between them the five poll average pops up to exactly 5.0%, which puts Virginia back in the “Weak Obama” category, but just barely. The next poll could easily knock Virginia back into a less than 5% lead for Obama and make the state a swing state again. But for the moment, we take Virginia off the list of states where Romney has a shot.
One thing to note about the Virginia results. One of the new polls I added today was a PPP poll that ended July 8th that included the Constitution Party Candidate, Virgil Goode, who took 9% of the vote, mostly from Romney, which of course improves Obama’s position. Generally I find out about polls quicker than that, but today is the first day this one popped up in one of the sources I use regularly.
My policy generally is to use polls that include third parties as long as the people they include are definite candidates and not speculative. Goode was named the candidate for the Constitution Party back in April, so he counts. Because of this I also retroactively added another Virginia poll from April that included Goode. This changes the historical chart slightly, as that old poll expands Virginia’s previous experiment with being “Weak Obama” from having covered just May 26 to June 4th, to covering the longer period May 4th to June 8th. One should note of course that support for third party candidates typically collapses as election day approaches.
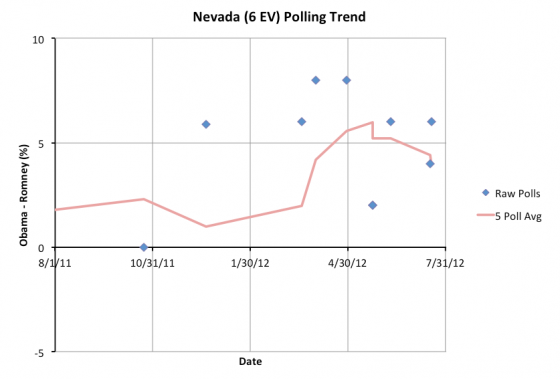
Next up is Nevada (6 ev). Recent polls show Obama’s lead slipping below 5%. So Nevada once again drops into swing state status. Obama’s lead in the five poll average is now 4.0%, which is not insubstantial, but is potentially within reach for Romney if events and the campaign narrative go his way. A 4% lead can disappear overnight with the right events in the news. So winning Nevada is once again considered part of Romney’s best case.
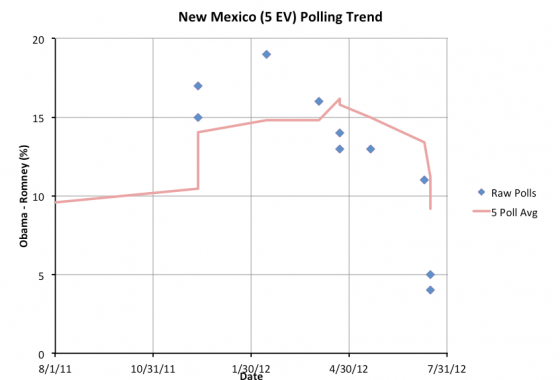
And finally New Mexico (5 ev). Obama’s lead in the five poll average drops under 10%, so I move it from “Strong Obama” to “Weak Obama”, but it is still not particularly close. Obama’s lead has to drop a lot more before it gets into swing state territory. Having said this, the last two polls in New Mexico are a very significant drop from earlier polls, and show things getting a lot closer. Both of these polls are from PPP though, one including Libertarian Gary Johnson, and one not including him. Since both polls are from one source, taken from the same underlying sample I believe, there is a chance they are outliers. We’ll have to wait for more polls to confirm. If this turns out to be real movement rather than sampling error, then this could be a pretty significant movement away from Obama in New Mexico.
So what does all this do to the overall situation? Well, New Mexico’s change does not effect the inventory of swing states, so it doesn’t affect the three main lines in our model at all. Nevada moves into swing status, but Virginia leaves it. Virginia is bigger, so today’s net effect is to make Romney’s best case worse by 7 electoral votes:
| Romney | Obama | |
|---|---|---|
| Romney Best Case | 304 | 234 |
| Current Status | 206 | 332 |
| Obama Best Case | 170 | 368 |
So, as a whole, Obama wins today’s updates. But Romney still has a variety of paths to victory. Over the course of June, he took a lot of states Obama was ahead in by more than 5% and made them close. Virginia has hit 5% again, but just barely. That may be ephemeral. We have a ton of states that are close right now. True, most of them are still on Obama’s side of the line, and Obama still wins handily if he takes every state he is ahead in. But you have to make states close before you make them yours, and Romney has slowly but surely been doing that.
Romney did have a bad week last week, but state polls are sparse enough, it takes more than a few days of bad news for a trend to start showing up in the electoral college models. If the current status in Virginia gets confirmed by more polls, and other states start going that way too, then perhaps this is a start of a movement back away from Romney and toward Obama. But for the moment it is too early to tell.
Edit 2012 Jul 20 14:04 UTC: Actually updated the historical chart with the Virginia correction, which I’d neglected to do when this was first posted. Sorry!

Leave a Reply
You must be logged in to post a comment.