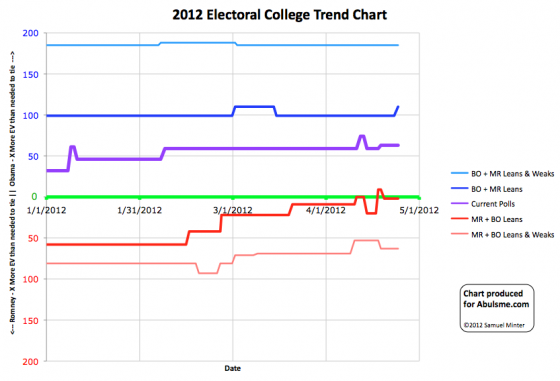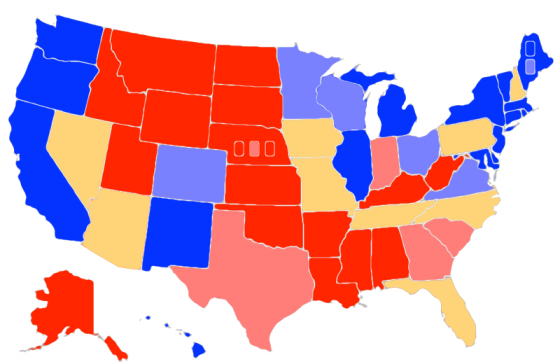

Chart and map from the Abulsme.com 2012 Electoral College Prediction page. Both assume Obama vs Romney with no strong third party candidate. Both show polling as it currently exists. Things will change before election day. Lines on the chart represent how many more electoral votes a candidate would have than is needed to tie under several different scenarios. Up is good for Obama, Down is good for Romney. On the map red is Romney, blue is Obama, gold states are too close to call.
Today Arizona moves from “Weak Romney” to “Lean Romney”, which makes it a swing state in our model.
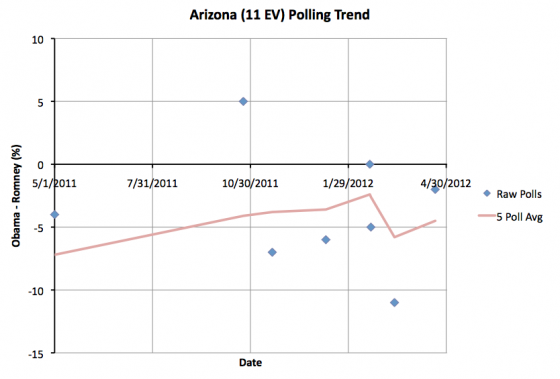
Starting with this update, when a state changes status, I’ll also show the polling history for that state, so the trend is visible.

Looking at the above you can see that the last five polls goes back more than three months. You can see the spread within those five polls. Seeing this information visually can help interpret the movement being discussed. In this case, Arizona goes back into the swing state category after a relatively short period as a “Weak Romney” state (since March 16th). There are a couple data points that look like they might be outliers but which still affect the average. And of course you can see that the 5 poll average is just barely in the less than 5% swing state zone. The next poll could easily change the category again.
This change improves Obama’s “best case” where we give him all of the swing states.
| Romney | Obama | |
|---|---|---|
| Romney Best Case | 271 | 267 |
| Current Status | 206 | 332 |
| Obama Best Case | 170 | 368 |
I’ll also note that movement in the national level polls toward Romney we talked about in previous updates seems to have been short lived. Looking at the RCP Poll Average Obama dropped from a lead of 5.3% on April 11th to a lead of only 1.7% on April 18th, but as of April 24th has rebounded to a lead of 3.7%. If the move toward Romney had been sustained, I would have expected to see a lot of state polls moving in Romney’s direction over the next few weeks. With the current trend that is no longer a safe assumption.
As things ebb and flow we will probably see movement toward Romney, but it won’t be the state polls catching up to the Romney spike of last week. It would be new changes based on new events.
But my general philosophy is that while the national polls are a leading indicator for the state polls and there is a strong correlation between the national popular vote and the electoral college, the real race is still the 50 separate state elections. That is how presidential elections work. So one gets a better picture of the dynamics by looking at the state numbers… although you need to be cognizant of the slower pace of state polling and interpret things accordingly. So we shall not speak of national level polls again.
Uh, unless there is something really interesting there to talk about. :-)
Edit 2012 May 2 13:08 UTC – Adjusted horizontal scale on Arizona graph
Leave a Reply
You must be logged in to post a comment.