States with new poll data added since the last update: All of them. Multiple times. There are additional new polls since I had to cut things off for this update as well. Those will be in the next update.
National Summary
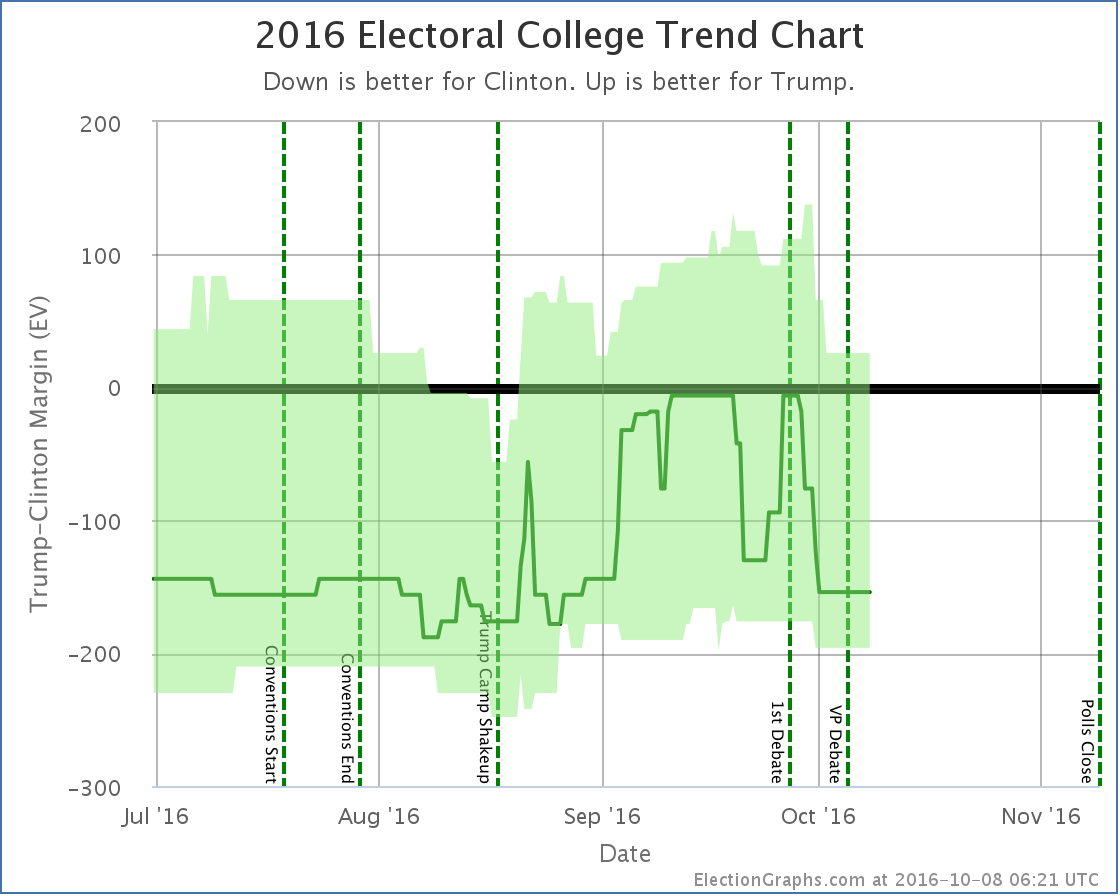
The last week of polls has been devastating to Trump’s position. In the last update we were just starting to see the reaction from the first debate. With this batch the post-debate polling continued to roll in, and while there were a couple of minor moves toward Trump, the net change in this update was a dramatic move toward Clinton:
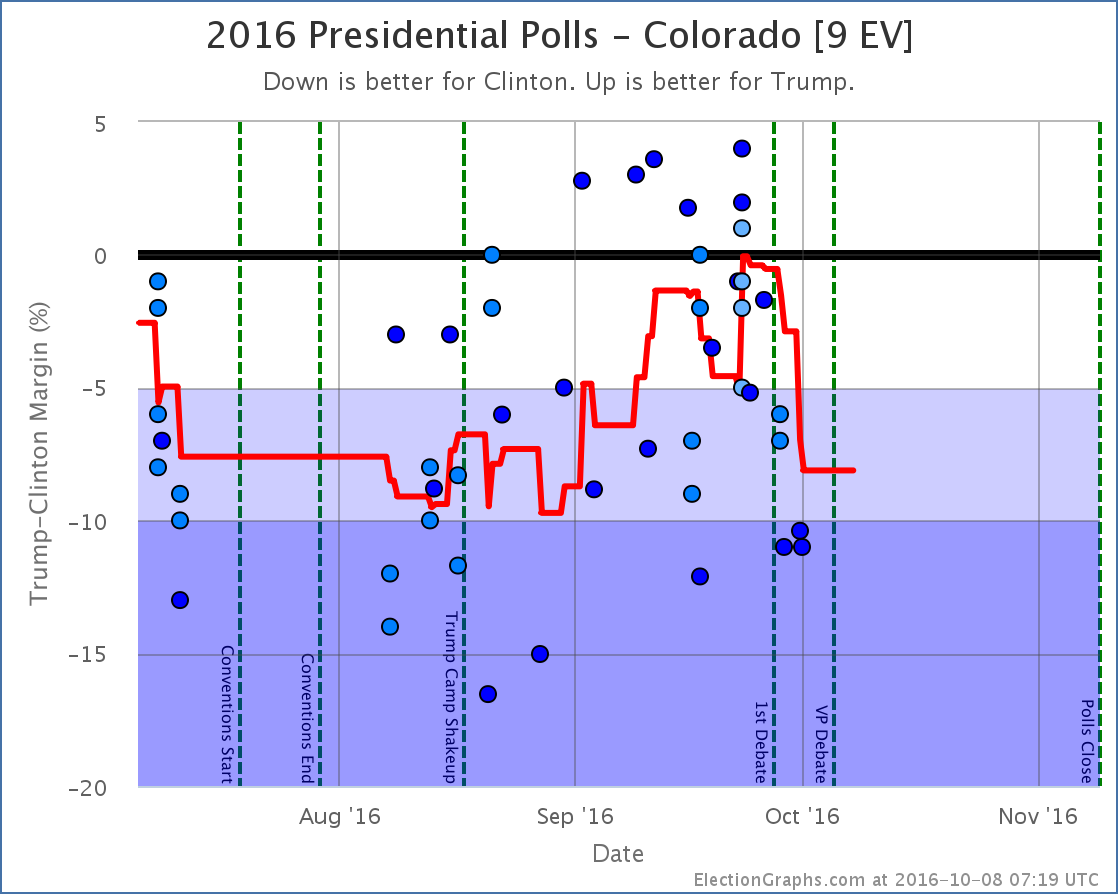
- The expected result moved from Clinton by 6 electoral votes to Clinton by 154 electoral votes
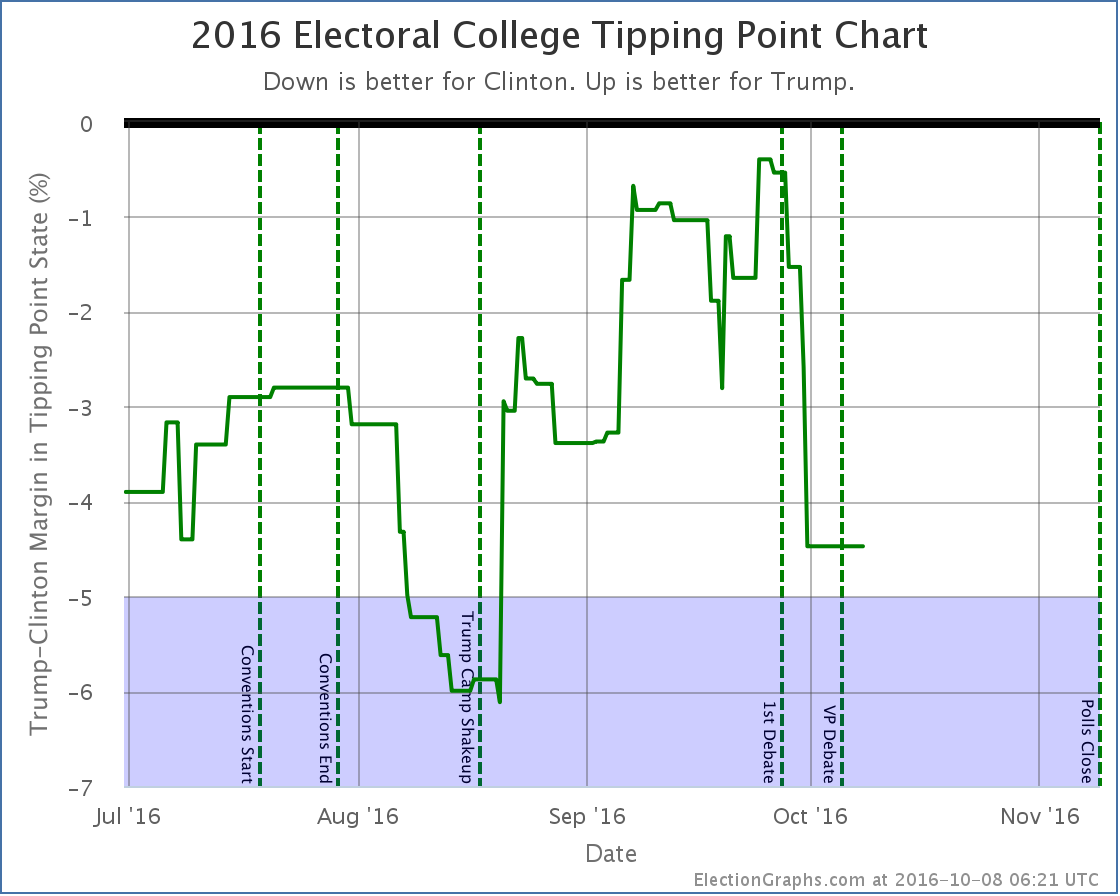
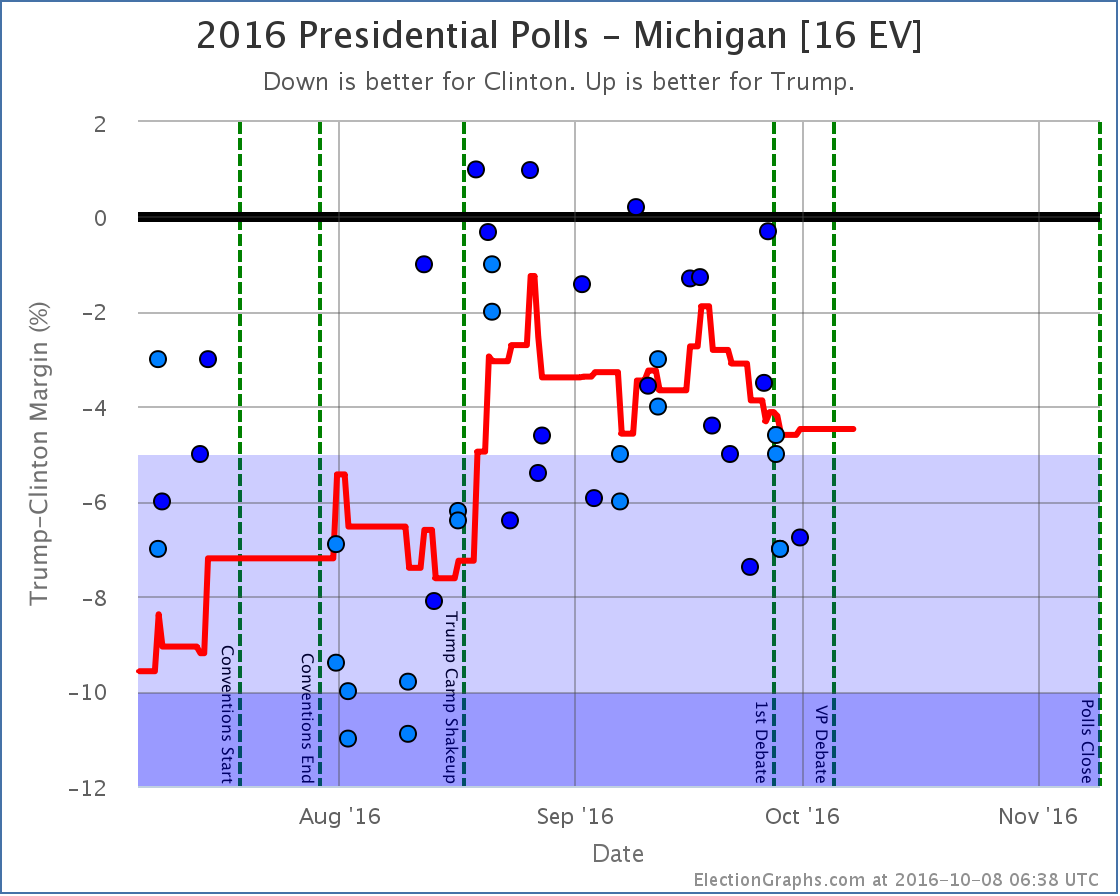
- The tipping point moved from Clinton by 2.1% in CO to Clinton by 4.5% in MI
- Trump’s best case moved from a 60 EV win to a 26 EV win
- Clinton’s best case moved from a 208 EV win to a 196 EV win
Looking at the charts:
The previous update mentioned some Trump losses starting a week or two before the debate. With a lot more polls filling in the time period right before the debate as well as right after, it now looks like those losses were reversed before the debate.
In the time after the debate though, all three indicators on the chart have moved in Clinton’s direction. The race is now essentially back to where it was at the beginning of September. We’re not yet back at Clinton’s high point from August, but it is getting close.
The tipping point chart is even more stark. As with the electoral college view, it looks like Trump’s mid-September declines were reversed by debate time, but after the debate everything falls off a cliff. Most of Trump’s gains from August and September are gone. Right before the debate he topped out with Clinton only ahead in the tipping point metric by 0.4%.
Clinton now leads by 4.5%. The tipping point state is Michigan. Clinton only has to increase her lead slightly there to not just take Michigan out of reach for Trump, but the Presidency.
What we are seeing in the polling results right now at this point probably fully factors in the debate itself. But we are just starting to see the impact from Trump’s “worst week in presidential campaign history ” that started with the debate, continued with his attacks on Alicia Machado, and ended with the leak of some of his tax information. The events of that week are not yet fully baked in.
And of course, the polls do not yet reflect the VP debate, or more importantly, the 2005 Trump video that was leaked on Friday. It is hard to imagine the events of the last few days NOT having an impact on the polls.
And the next debate is coming up. It should be interesting. If you were not planning on tuning in before, change your plans.
31.7 days left until the first actual election results start coming in.
State Details
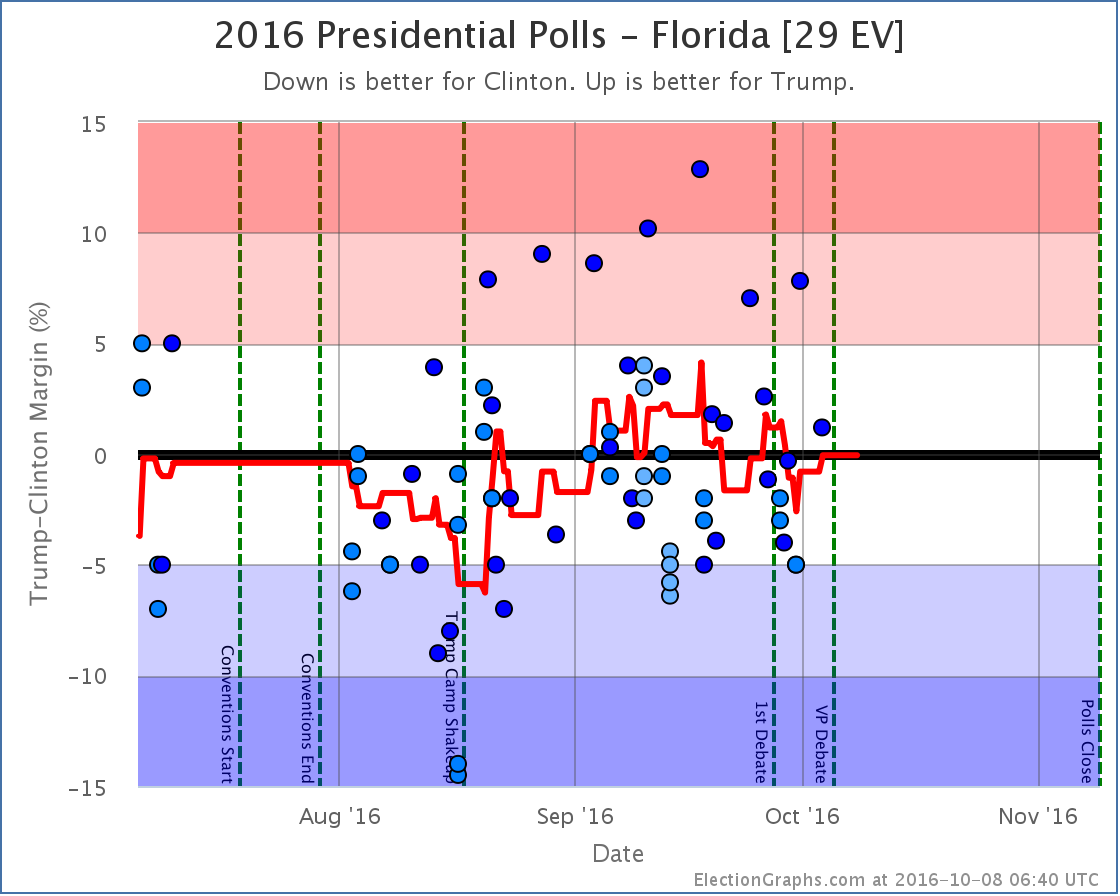
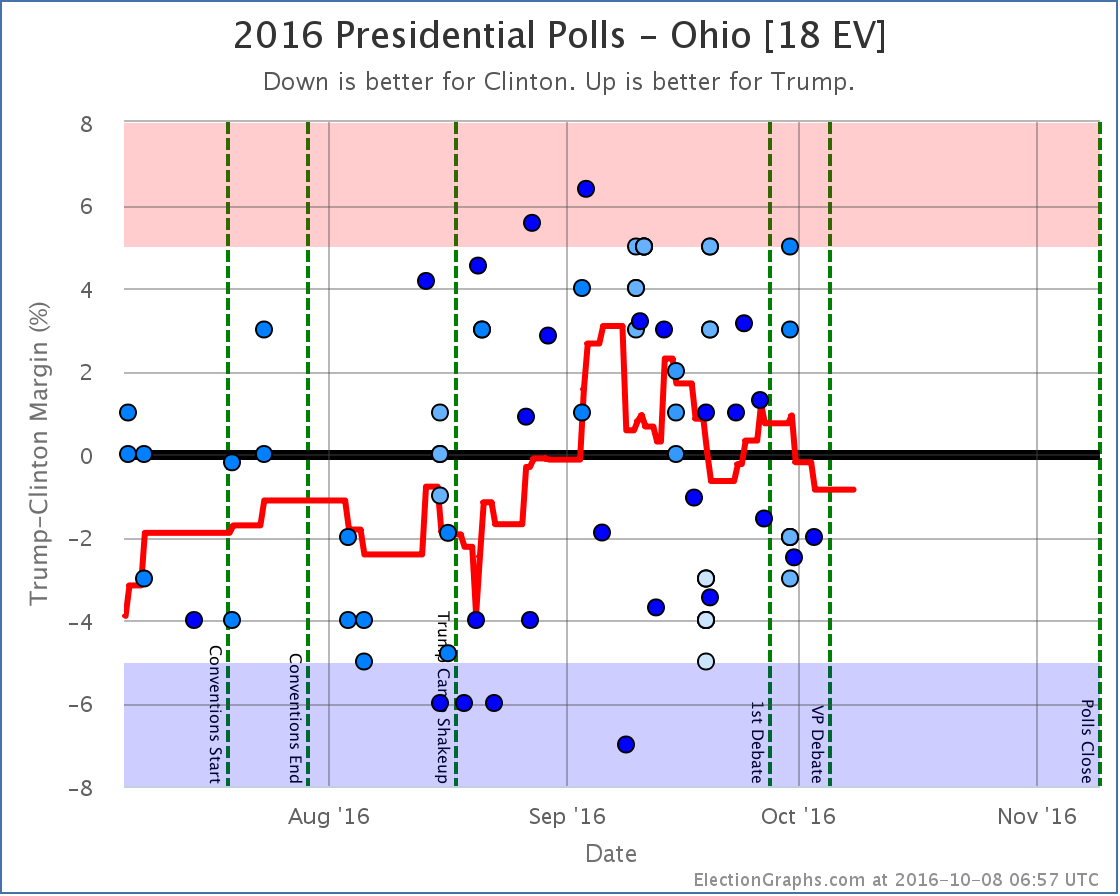
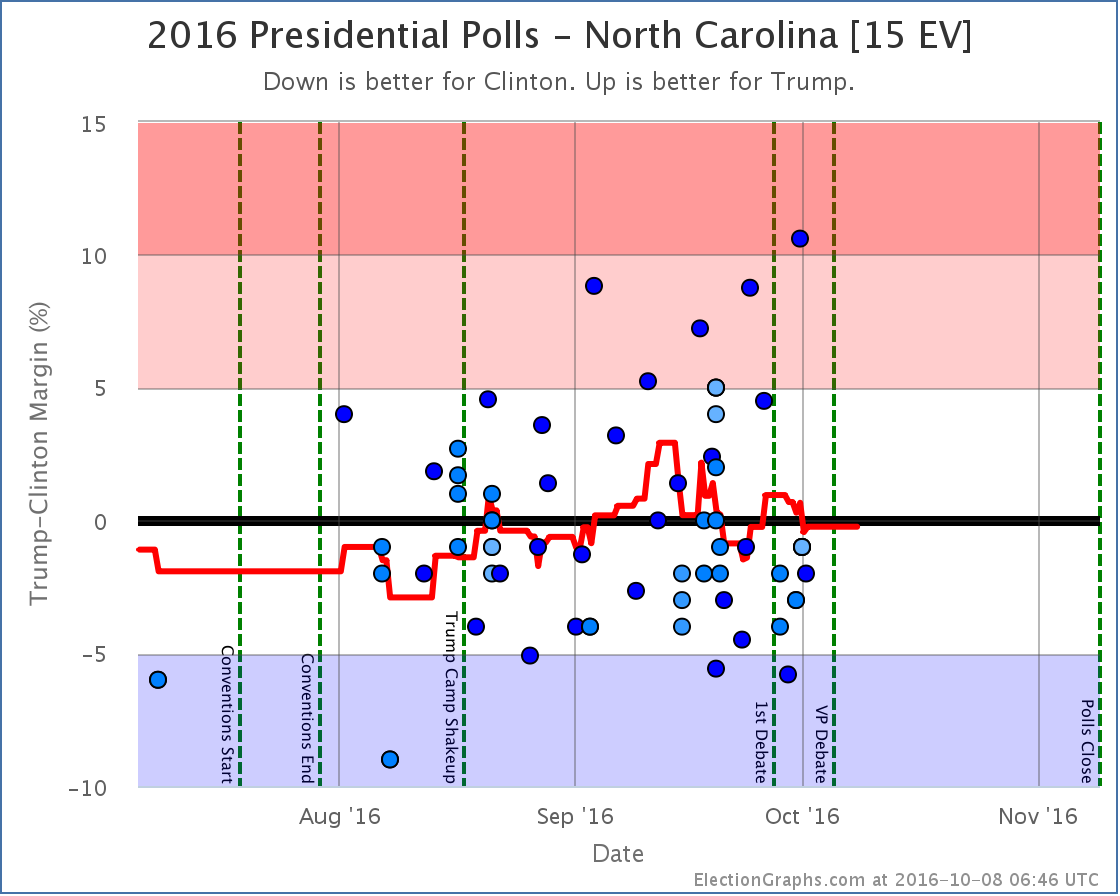
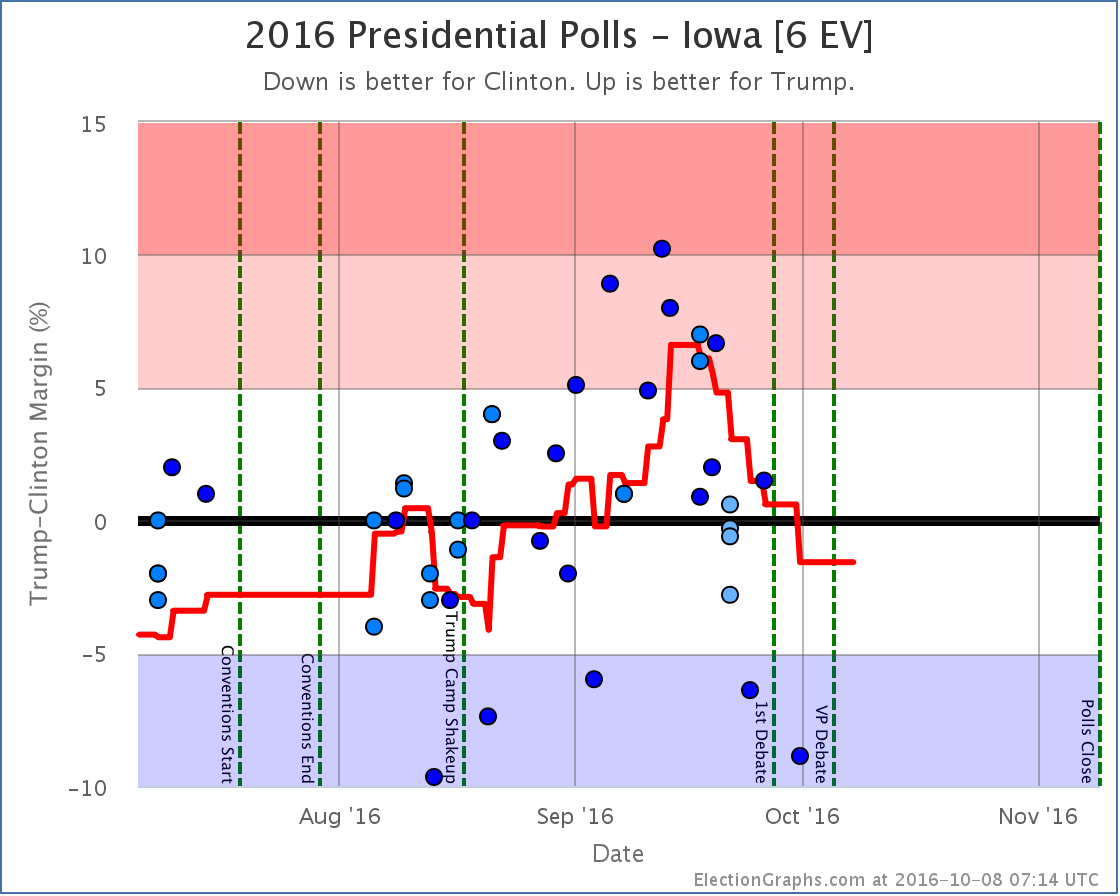
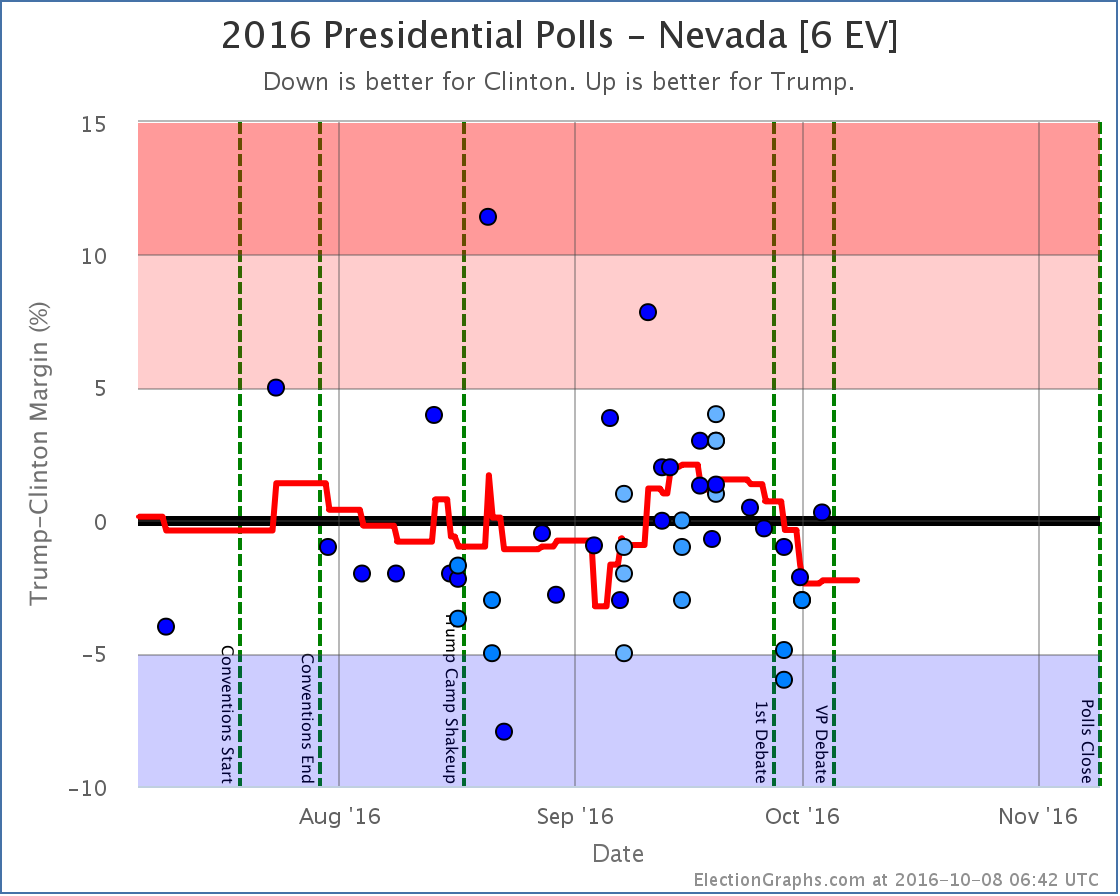
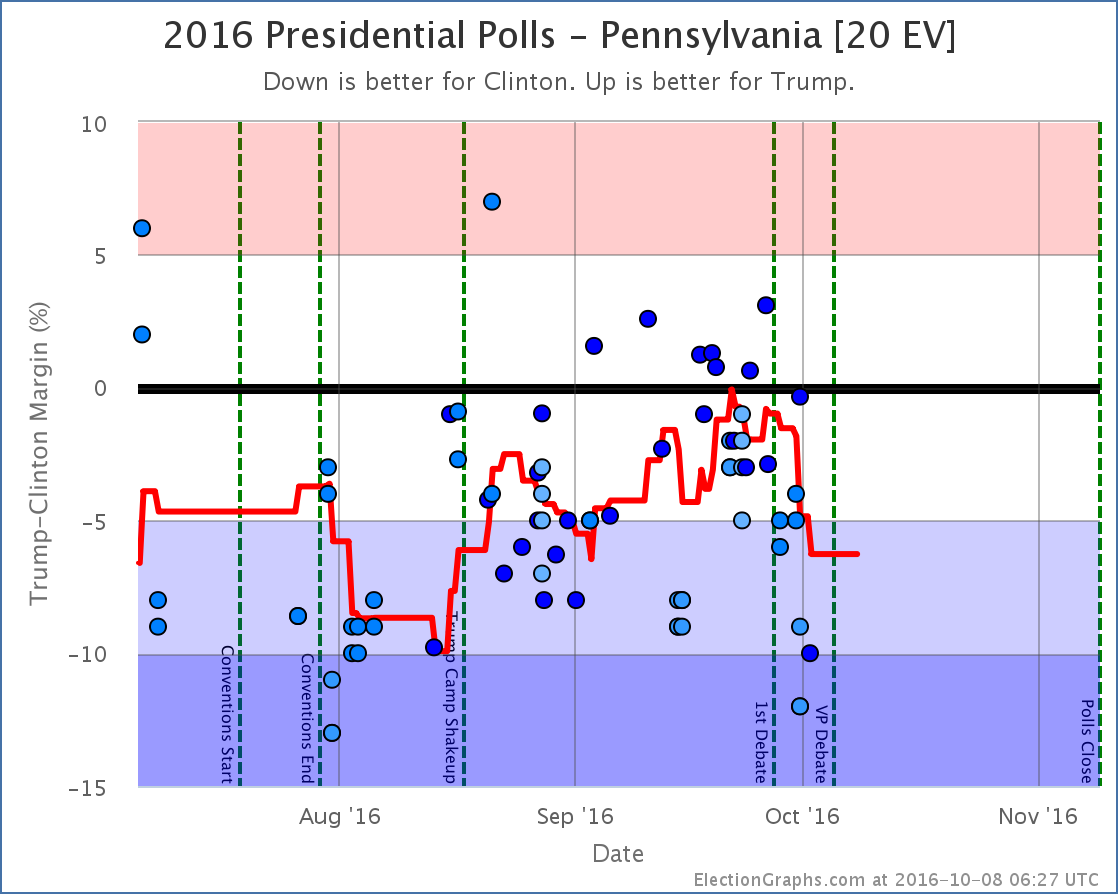
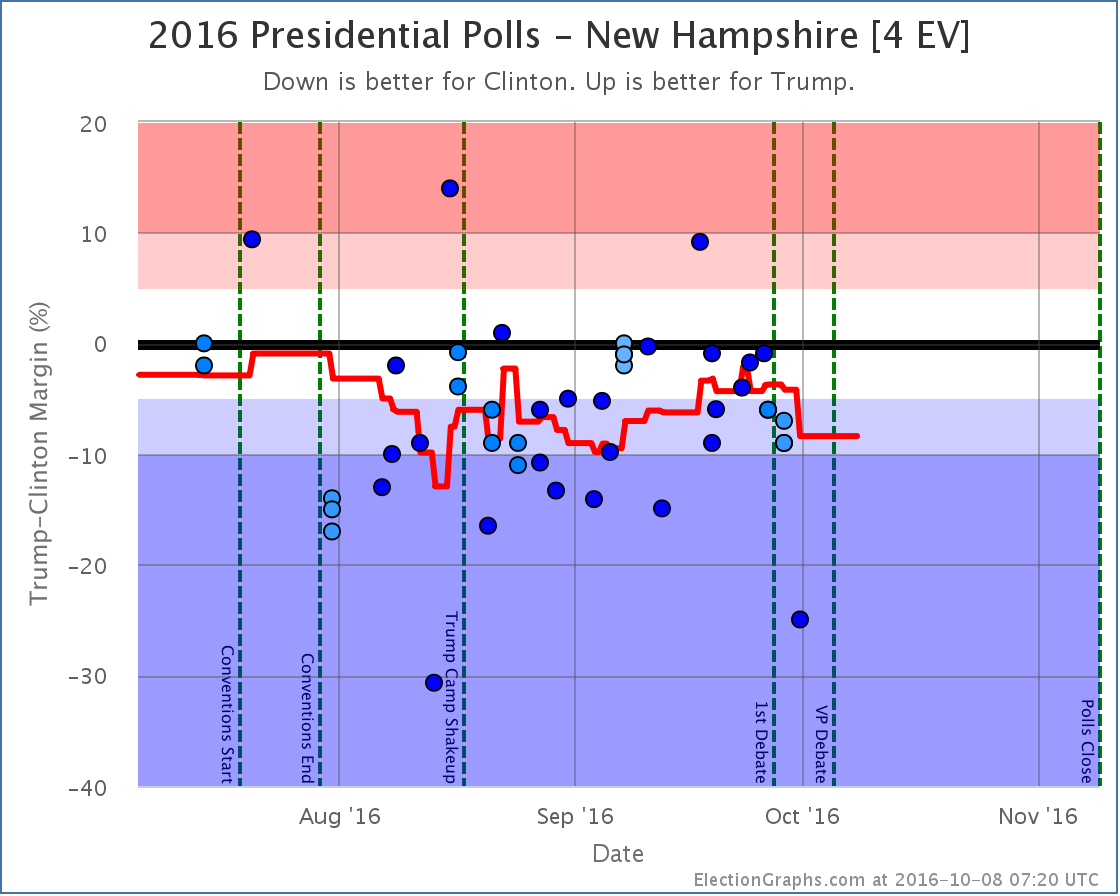
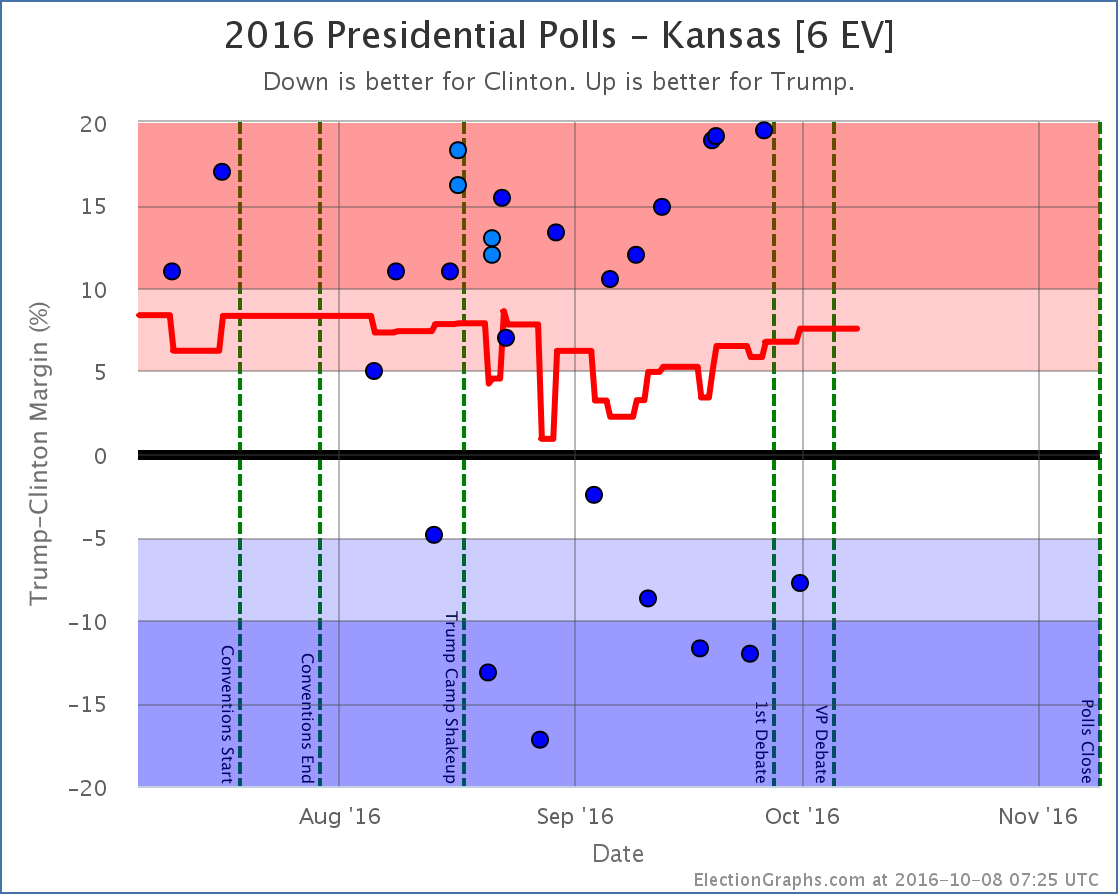
A lot of states moved in order to produce the summary results above. For those interested in looking at the state by state details, they are below:
Weak Trump to Weak Clinton
Moving out of reach for Trump
Moving out of reach for Clinton
Moving into reach for Trump
States that changed categories but then moved right back again
For more information…
This post is an update based on the data on ElectionGraphs.com. Election Graphs tracks both a poll based estimate of the Electoral College and a numbers based look at the Delegate Races. All of the charts and graphs seen in this post are from that site. Additional graphs, charts and raw data can be found there. Follow @ElectionGraphs on Twitter or like Election Graphs on Facebook to see announcements of updates or to join the conversation. For those interested in individual general election poll updates, follow @ElecCollPolls on Twitter for all the polls as they are added. If you find the information in these posts interesting or useful, please consider visiting the tip jar.
[Blog Post] Electoral College: Trump’s Polling Meltdown https://t.co/Lp8yW8f58T
RT @ElectionGraphs: [Blog Post] Electoral College: Trump’s Polling Meltdown https://t.co/Lp8yW8f58T
Ivan Bou liked this on Facebook.
Juana Venegas Duque liked this on Facebook.
Wow. I may be misreading this, but these graphs, particularly the tipping point, seem to show huge shifts in opinion over a very short period of time. Do these results indicate a genuine volatility or is it a numerical mirage? In particular, if such dramatic changes are possible, does this mean we shouldn’t trust the current numbers to stay stable?
(Also, is this a completely new phenomenon? I don’t recall previous elections having any changes of similar magnitude and velocity.)
Bob Frump liked this on Facebook.
Ben,
Have a look at
http://fivethirtyeight.com/features/the-bottom-could-fall-out-for-trump/
There is mention of your volatility question. In essence, yes polls can be volatile and this is relatively common.
This definitely seems to come into the category of ‘October Surprise’ and could put this out of Trump’s reach. On the other hand, he did say he could shoot someone on 5th Avenue and still pick up votes.
Given the partisan nature of US politics anyone with (R) or (D) after their name in a presidential election should pick up 40% of the vote at minimum, if not more.
Be a little wary of claiming this as an opinion shift. There are four reasons I can think of that could have contributed to a polling shift, of those four only one is really a change of mind (well, maybe two, depends how you define them).
1 – Swing voters
These are the opinion shifts, be they between Trump and Clinton (or vice versa) or third party and Trump/Clinton.
2 – Undecided voters decide
Maybe classed as a shift, but I wouldn’t. This is just the ‘don’t know’ people deciding on a candidate.
3 – Enthusiasm factor
Clinton supporters become more energised, Trump supporters more likely to stay home. This factor affects the polling firms ‘likely voter screen’ so those less enthusiastic are less likely to vote and so are not counted in the final tally (where a registered voter poll would include everyone regardless of enthusiasm).
4 – ‘Shy Tory’ effect
In a U.K. General election some years ago the Conservative party were underestimated in the polls because (supposedly) people didn’t want to be seen as supporting them (similar, but I believe opposite to the ‘Bradley effect’ where people don’t want to be seen as voting against a candidate). This would realistically only apply in live polls, as it’s apparently stating the preference to an interviewer that causes the problem. It is entirely possible that a few people would now be embarrassed of admitting to supporting Trump.
I can’t even begin to say how much of each is a factor in current polling but the first two will be the likely largest influences on polling numbers.
The Nate Silver article is interesting, particularly “volatility” versus “uncertainty”. But I’m not sure he’s addressing what I’m talking about. When he says the level of volatility is not unusual, he shows a picture of the national average compared to 2012 with a footnote saying he’ll explain later.
While the national average this year had larger magnitude shifts compared to 2012, they were relatively slow. I’m talking about the even more massive and incredibly rapid changes in the electoral college margin and the tipping point. The velocity of the changes this year look like a seismograph. I’ve composited 2012’s EC chart (the purple line) onto the current one, scaling it to match, and I think you can see what I mean. (http://pasteboard.co/cOGU3gEfB.png, https://postimg.org/image/7rid6gg21/)
And, if Nate Silver is right, that polls are expected to be this volatile, what is the point in following them? A high variance where huge leads can appear and disappear quickly makes one question the predictive power of polls.
I think it depends what you’re predicting..
Polls are an indication of ‘if the election were held today then…..’
You can still make some predictions, even with the volatility, and be reasonably certain about them. For example, ‘Clinton will win DC and CA’ is a prediction you might say is 99% safe, whereas saying ‘Clinton will win FL and OH’ is more risky at maybe 50%, ‘Clinton to win SC and TX’ may be down at 5% (although that may change after this week). All those are predictions, based on a mix of polling, experience, history, gut feeling and guesswork.
The volatility at present seems to be more about the final margin (narrow victory or landslide) than the winner, but there could be more surprises.
Polls are volatile because PEOPLE are volatile. People make up their minds, change their minds, low information voters tune in, news breaks and so on. Don’t think of polls as just a series of numbers, they are real people who have answered the questions. I don’t know your own political leanings, but a lot of people are influenced by news, debates and the like, only the diehard partisan will be unswayed by ANY action, surprises, news or arguments. The Trump tape may be something that, like the 2008 recession, turns the election from fairly close into a foregone conclusion.
Polls don’t always get it right. Just ask president Dewey! They are reasonably good at indicating where things currently stand though.
I’m sorry but I’m not following your point on the comparison between elections either. I don’t think your chart makes sense because you’re only putting a single data line onto a complex graph. If you were to put the full 2012 equivalent, complete with tipping points and result range, then you’d have a comparison. As it is, I don’t believe you can draw a conclusion.
Other things to bear in mind are differences between 2012 and 2016.
2012 had an incumbent, 2016 doesn’t
2012 was a traditional campaign, 2016 is not
2012 had later conventions
2016 has historically disliked candidates
It may be that 2008 is a better comparison to 2016 as far as non incumbent, October surprise and odd candidates (Yes Ms Palin, I mean you) but again you’d have to find historical data.
If you look at this
http://www.electoral-vote.com/evp2016/Pres/ec_graph-2016.html
You can see that, side by side, 2004 seems to have been even MORE volatile than 2016
https://t.co/lp0IRjFwIh: Electoral College: Trump’s Polling Meltdown #TrumpPence16 #MAGA #TeamTrump https://t.co/klcc7VyiBX
RT @Sandy12653: https://t.co/lp0IRjFwIh: Electoral College: Trump’s Polling Meltdown #TrumpPence16 #MAGA #TeamTrump https://t.co/klcc7VyiBX
Ben, I like your graphic putting this years results and 2012’s on top of each other, but it is scaled wrong! In 2016, the Y axis on my charts is Republican – Democrat. But in 2012, it was how many more electoral votes the candidate had than needed to tie. In other words, “Obama – 269”. To get the comparison right, you need to stretch the 2012 picture so that what is marked “50” matches “100” on the 2016 charts. (I also had Democrats up in 2012, so you would also want to mirror it vertically to make it match party-wise as well.)
For comparing volatility between election cycles, Sam Wang did a good post on this recently:
http://election.princeton.edu/2016/10/09/how-should-volatility-be-defined/#more-17843
His conclusion is that 2016 is less volatile than an average presidential election cycle, and actually pretty stable over all. Of course,
One way to look at it is that first of all because of the winner take all nature of the electoral college, that measure will ALWAYS make big moves, even when the underlying polling data changes are small. The tipping point should be more stable (my tipping point is roughly equivalent to his meta-margin) but of course it will still see movement. The “big move” we saw since the first debate in my tipping point is about 6%. One of the reasons I set my thresholds for “Weak” states that could go either way at 5%, is this is an amount of movement that can indeed happen pretty quickly as a reaction to news events. (It also is a level where you could conceivably imagine a systematic poll bias.) A 5% swing in the margin is just a few percent of people changing their answers on poll questions. It is not really that huge a swing. It just is a very important swing if you happen to have a race where the overall margin is in that same order of magnitude.