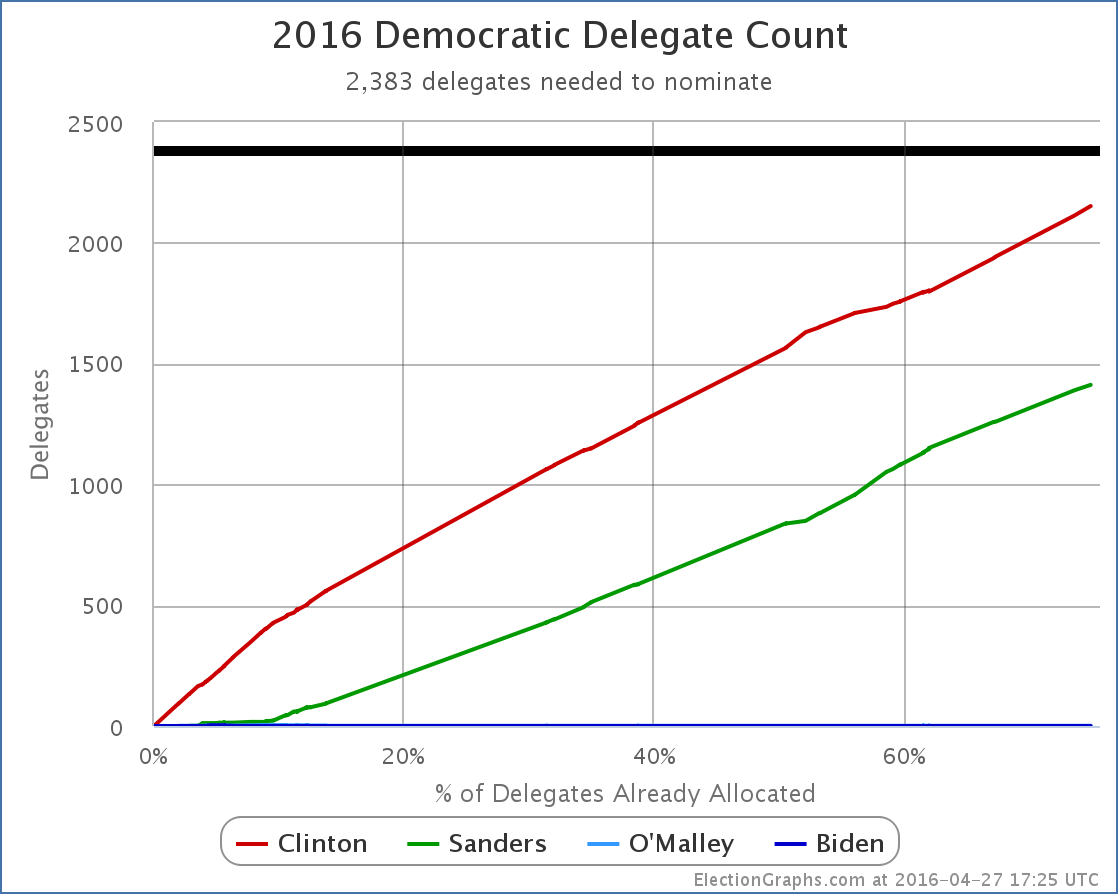
Even the Sanders folks are starting… just starting… to admit it might be over.
Clinton won 218 delegates yesterday. Sanders won 166.
In addition, since New York there were new superdelegate endorsements and updates in Illinois and Ohio which have netted Clinton +9, Sanders +1.
So including everything since New York, we have Clinton +227, Sanders +167.
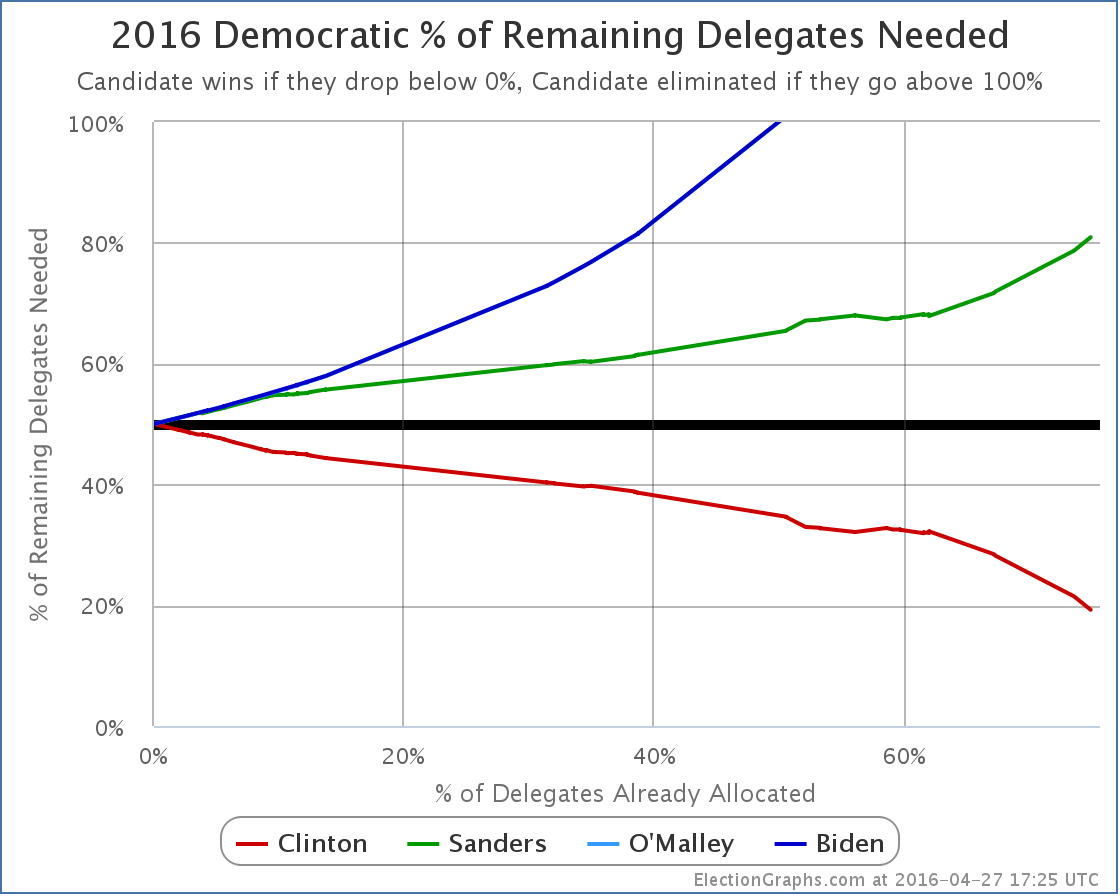
That means Clinton got 57.61% of the delegates. She only needed 28.73%.
Meanwhile Sanders got 42.39% of the delegates. He needed 71.39%.
In practical terms this has been for over a long time. Absent a huge unexpected event of course.
But we still watch it play out.
Here are the relevant graphs:
Clinton now only needs 231 of the remaining 1200 delegates to win. That’s 19.25% of the remaining delegates.
Sanders on the other hand needs 971 of the 1200. That is 80.92%.
Guess which is most likely?
Or, of course, still, tons of Clinton superdelegates could defect and change this a bit. I wouldn’t hold my breath for that though.
Update 2016-05-01 17:08 UTC: Superdelegate updates plus change to Ohio pledged delegates. Net change: Clinton +11, Sanders -1.
Note: This post is an update based on the data on ElectionGraphs.com. Election Graphs tracks both a poll based estimate of the Electoral College and a numbers based look at the Delegate Races. All of the charts and graphs seen in this post are from that site. Additional graphs, charts and raw data can be found there. All charts above are clickable to go to the current version of the detail page the chart is from, which may contain more up to date information than the snapshots on this page, which were current as of the time of this post. Follow @ElectionGraphs on Twitter or like Election Graphs on Facebook to see announcements of updates or to join the conversation. For those interested in individual general election poll updates, follow @ElecCollPolls on Twitter for all the polls as they are added.


Leave a Reply
You must be logged in to post a comment.