The March 5th states have voted. Trump won Kentucky and Louisiana, Cruz won Kansas and Maine. But states don’t matter. Lets look at delegates:
From March 5th: Cruz +68, Trump +53, Rubio +13, Kasich +10 and 11 still TBD.
In addition since my Republican Super Tuesday post was originally published we had Cruz +8, Trump +4, Carson -1, Rubio -5 as vote counting finished and results were finalized.
So since the last post, Cruz +76, Trump +57, Kasich +10, Rubio +8, Carson -1.
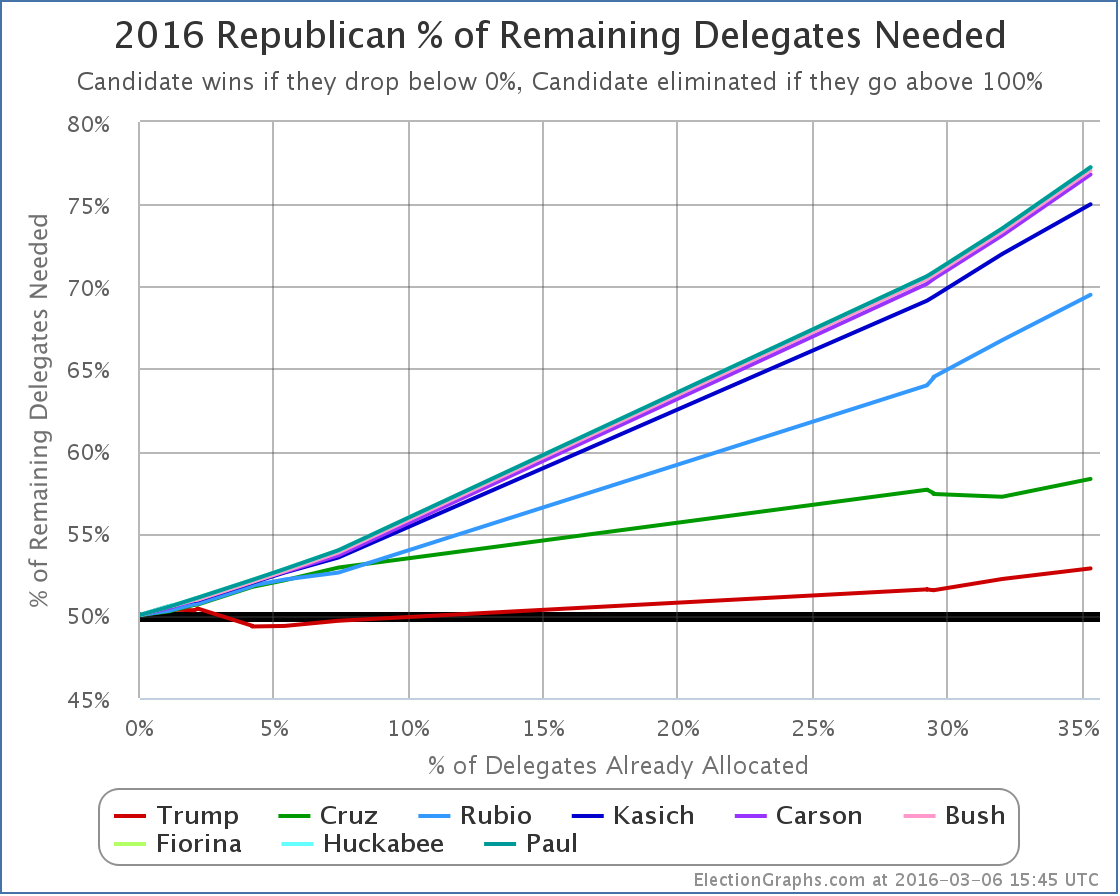
Lets look at the all important “% of remaining delegates needed to win” graph:
Cruz did the best here, but in order to actually improve his position in terms of winning the nomination outright, he needed to get 57.7% of the delegates since my March 2nd update. Actual result above? 50.67% of the delegates since then. He didn’t get there.
Meanwhile, Trump only needed 51.6% of the delegates, but he only got 38.00%. He didn’t even come close to getting what he needed.
Bottom line, NOBODY is getting the delegate numbers they need for a win. This may change as things progress, but for the moment, we’re still on the narrow road to a contested convention.
All of those lines are above 50%, and all of those lines are headed up. For someone to win outright, one of those lines needs to start heading down and start driving toward zero. Right now it hasn’t happened yet.
Right now Trump needs 52.88% of the remaining delegates to win outright. So the non-Trump’s collectively need to be getting 47.12% of the delegates to force a contested convention.
I stated in the Super Tuesday post that in order to keep on this path, the non-Trump’s not only need to keep Trump above that 50% line until the big winner take all states like Florida and Ohio vote on March 15th, but they need to damage Trump to the extent that he is losing states left and right once we are in the winner take all zone. Very specifically, he probably needs to lose Florida and Ohio.
Trump underperformed his polling in the March 5th states, and Cruz exceeded his. The polling was pretty sparse, but this may indicate that the onslaught of attacks against Trump by Rubio, Cruz, and others in the last two weeks may be starting to take a toll on Trump. Perhaps his own debate performances have hurt as well by signaling a general election pivot a bit too soon… or perhaps he just finally passed some sort of line on the outrageous behavior front. Polling is frustratingly sparse in the upcoming states, so it is hard to tell what the situation is, let alone if it changed due to attacks, debates, or pivots.
The big question is: “Has Trump been damaged enough that the non-Trumps can force this to the convention?”.
Right now, we are on track for that!
Don’t get too excited about that possibility quite yet though… Current polling has Trump still ahead in a number of upcoming states, including the critical races in Florida and Ohio. If he maintains those leads, this may get pushed back into territory where Trump can win outright after March 15th. All it takes is a couple of Trump wins in big winner take all states, and dreams of a contested convention will go up in smoke.
But… but… if the damage to Trump is real and sustained, we may start seeing Trump weakness elsewhere soon, including in Florida and Ohio. If so, the chances of a contested convention will go up very quickly. (The odds of one of the non-Trumps winning outright are still very small.)
Next up, in just a few hours: Puerto Rico. As far as I can tell, there has been no polling in Puerto Rico at all. We’ll see how it goes…
[Update 17:31 UTC – Unrelated to March 5th, but looks like one Georgia delegate flipped from Cruz to Rubio as results there were finalized. This doesn’t substantively change the analysis above.]
Note: This post is an update based on the data on ElectionGraphs.com. Election Graphs tracks both a poll based estimate of the Electoral College and a numbers based look at the Delegate Races. All of the charts and graphs seen in this post are from that site. Additional graphs, charts and raw data can be found there. All charts above are clickable to go to the current version of the detail page the chart is from, which may contain more up to date information than the snapshots on this page, which were current as of the time of this post. Follow @ElectionGraphs on Twitter or like Election Graphs on Facebook to see announcements of updates or to join the conversation. For those interested in individual general election poll updates, follow @ElecCollPolls on Twitter for all the polls as they are added.

Leave a Reply
You must be logged in to post a comment.