The Iowa caucuses have finally come and gone, and we have the first “earned” delegate results of the nomination race. Sorta. No actual Democratic delegates were actually determined. It was just the first step in a multi stage process. But as of now, estimates can be made. The estimates as per The Green Papers are 23 delegates for Clinton and 21 for Sanders. There were also 4 Iowa superdelegates already for Clinton.
So the Iowa totals as of this post are: 27 Clinton, 21 Sanders, 4 superdelegates TBD.
Even if all 4 remaining superdelegates went for Sanders, which is unlikely, Clinton still wins Iowa 27 to 25.
This despite the predominant reporting of tonight’s results as a tie or near-tie for Sanders.
In addition, since my last post on the Democrats in other states there have been 3 additional super delegates who came out for Clinton, and 2 who came out for Sanders.
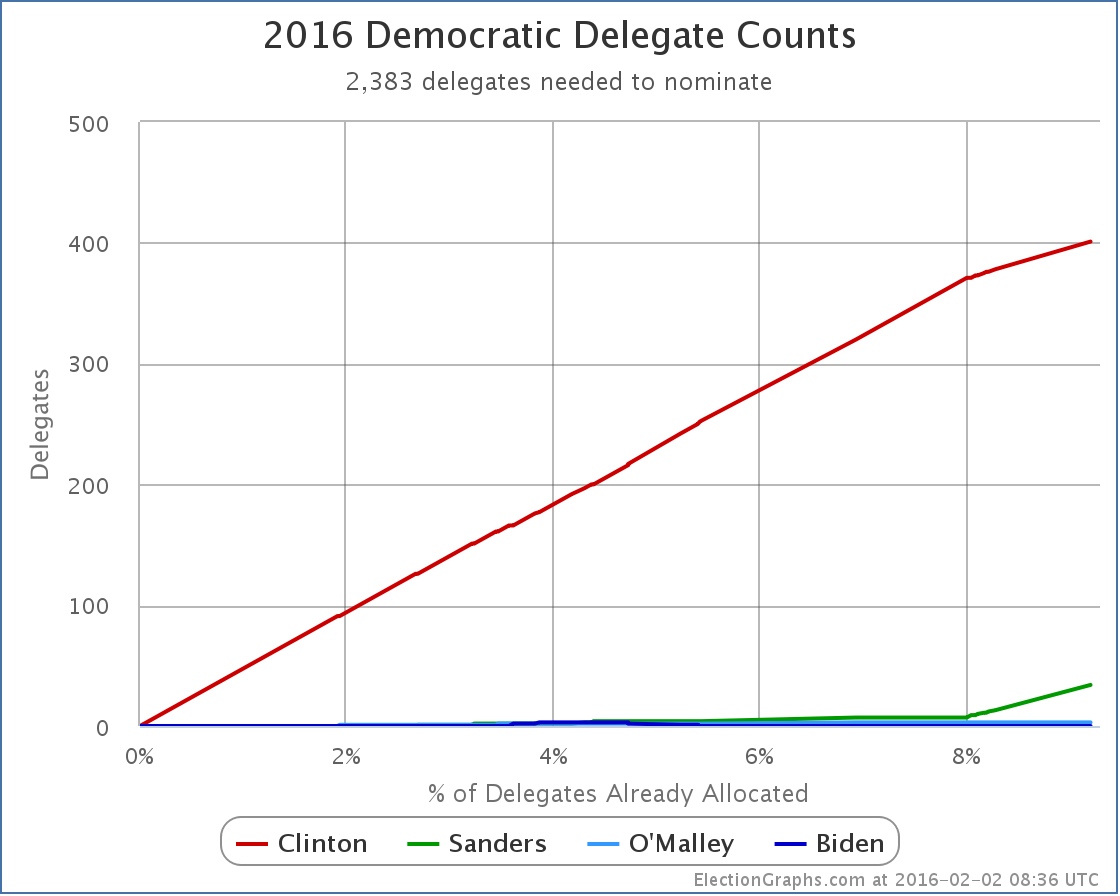
So, where does that put us? First, the raw delegate totals:
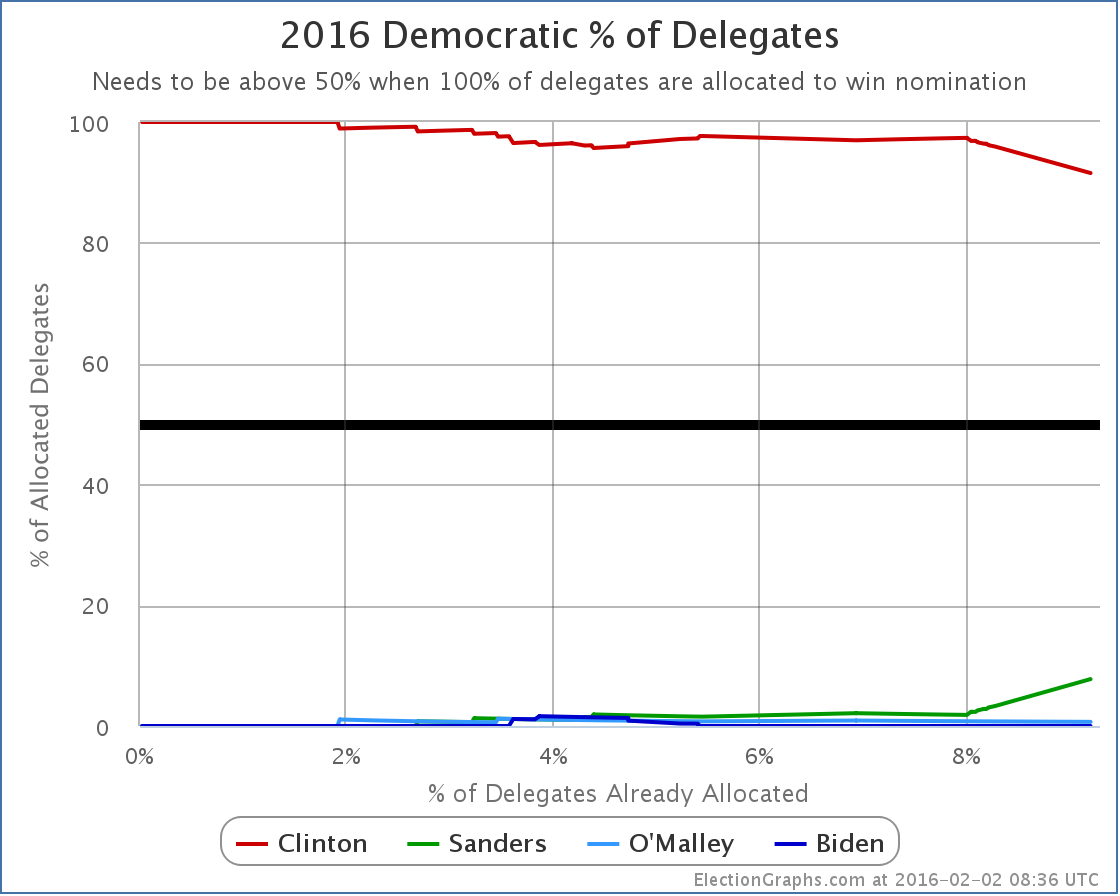
You can see the “kink” in the chart that is the result of Clinton getting a much smaller percentage of the Iowa delegates than her absolute domination in the superdelegate race. This of course means her percentage of the delegates so far takes a bit of a swoon:
Clinton is down to only 91.55% of the delegates allocated so far! That’s the lowest she has been so far!
OK, that is down, but actually it is still pretty dominant.
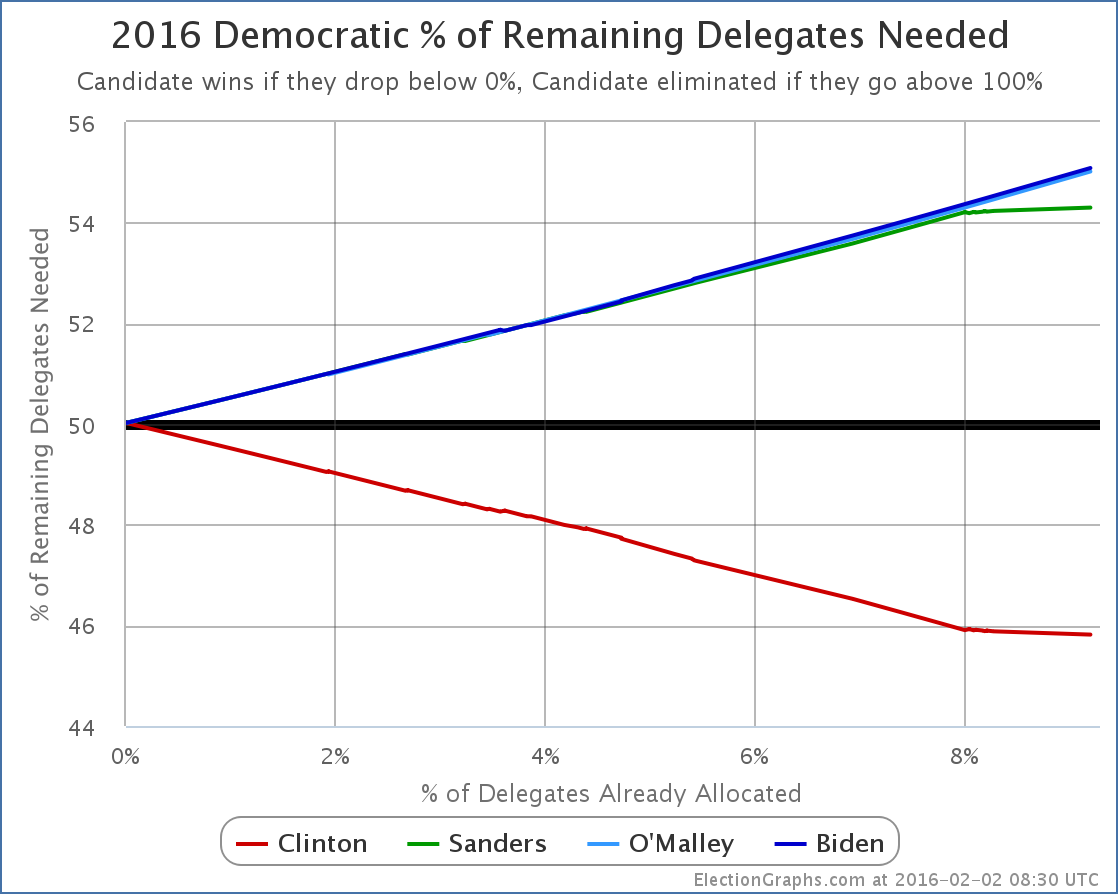
But what does all this do to the critical “% of remaining delegates needed to win”?
When I made the last blog update, Sanders needed 54.22% of remaining delegates to win. Right before tonight’s new Iowa results, that had moved to 54.23%. Adding in the Iowa results it is now… 54.30%. So up a little, but really not by much. Sanders did not do well enough to bring this percentage down. It has to actually go down for Sanders to be on a pace to catch up and win. But he at least did well enough to keep it from getting very much worse than it was.
Looking at the New Hampshire polling, Sanders is currently at 55.5% in the RCP average and 55.2% in the Pollster average. Either way, that is a smidgen above 54.30%. So even if he gets no boost in New Hampshire from his near tie with Clinton in Iowa, Sanders may meet the bar he needs in order to improve his numbers on this metric. He doesn’t have much leeway though. If he drops at all, then he essentially will fall even further behind after New Hampshire.
The states beyond New Hampshire of course look more hostile to Sanders based on early polling. To make any real race out of this, something would need to happen that would cause Clinton to not just do a little worse, but a lot worse. Otherwise, the rest of this Democratic race is just going to be a process of Clinton mopping up, no matter what sort of media hubbub results after a potential Sanders win in New Hampshire.
Note: This post is an update based on the data on ElectionGraphs.com. Election Graphs tracks both a poll based estimate of the Electoral College and a numbers based look at the Delegate Races. All of the charts and graphs seen in this post are from that site. Additional graphs, charts and raw data can be found there. All charts above are clickable to go to the current version of the detail page the chart is from, which may contain more up to date information than the snapshots on this page, which were current as of the time of this post. Follow @ElectionGraphs on Twitter or like Election Graphs on Facebook to see announcements of updates or to join the conversation. For those interested in individual general election poll updates, follow @ElecCollPolls on Twitter for all the polls as they are added.


[Blog post] Democrats: Sanders Iowa Tie is a Clinton Win https://t.co/nR0lTJxLGQ
Brandy Donaghy liked this on Facebook.