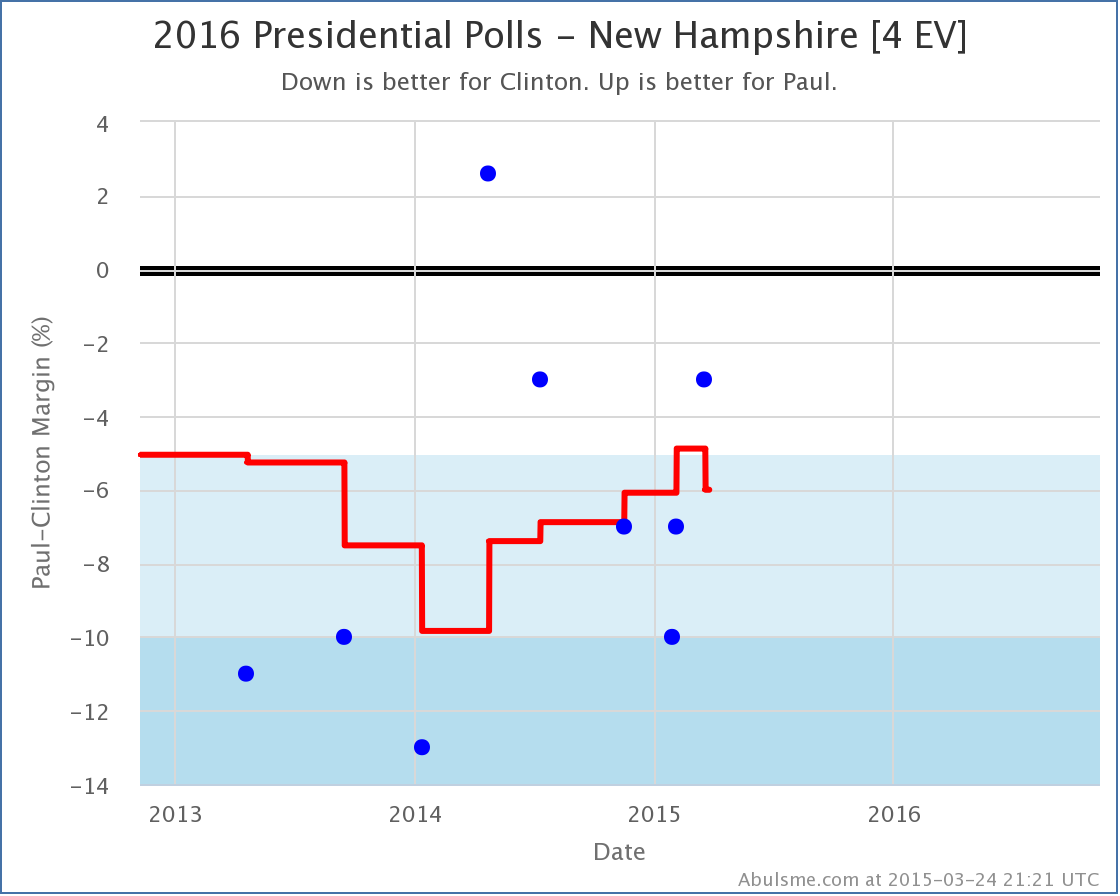
A bunch of new polls were added to my site today, but there was only one notable change. With a new Gravis Poll, Clinton’s lead in New Hampshire against Paul once again goes over 5%.
Easy come, easy go I guess. This decline happens as the only poll so far showing Paul in the lead here falls off the average. That poll is looking more like an outlier at this point. Even without that one poll though, if you squint there does seem to be a general trend in Paul’s direction over the last year or so. As usual, we’ll have to wait for more polls to see if Paul resumes closing the gap in the average, or if this is actually a reversal of the trend.
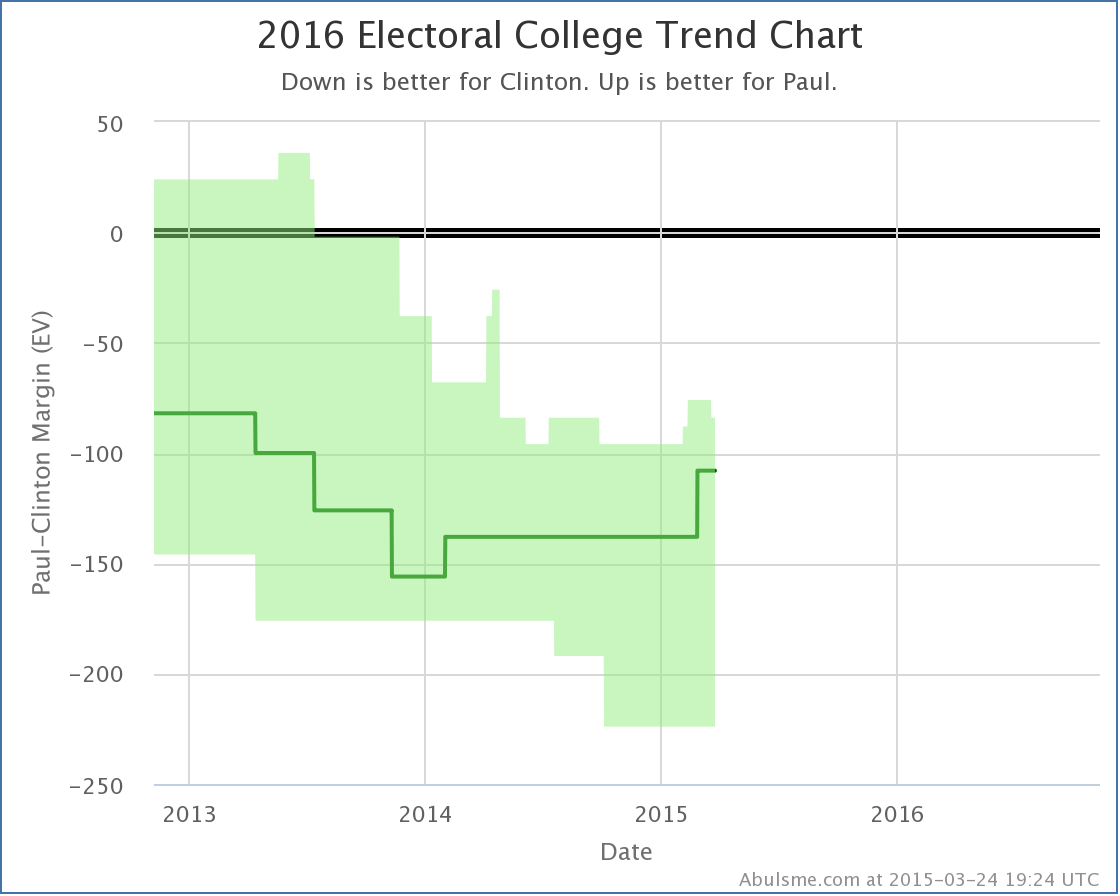
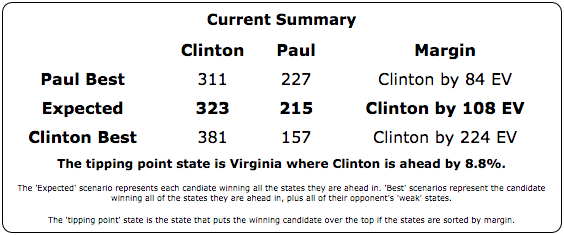
With New Hampshire now at a 6.0% Clinton lead in the average, it gets taken out of Paul’s “best case” scenario…
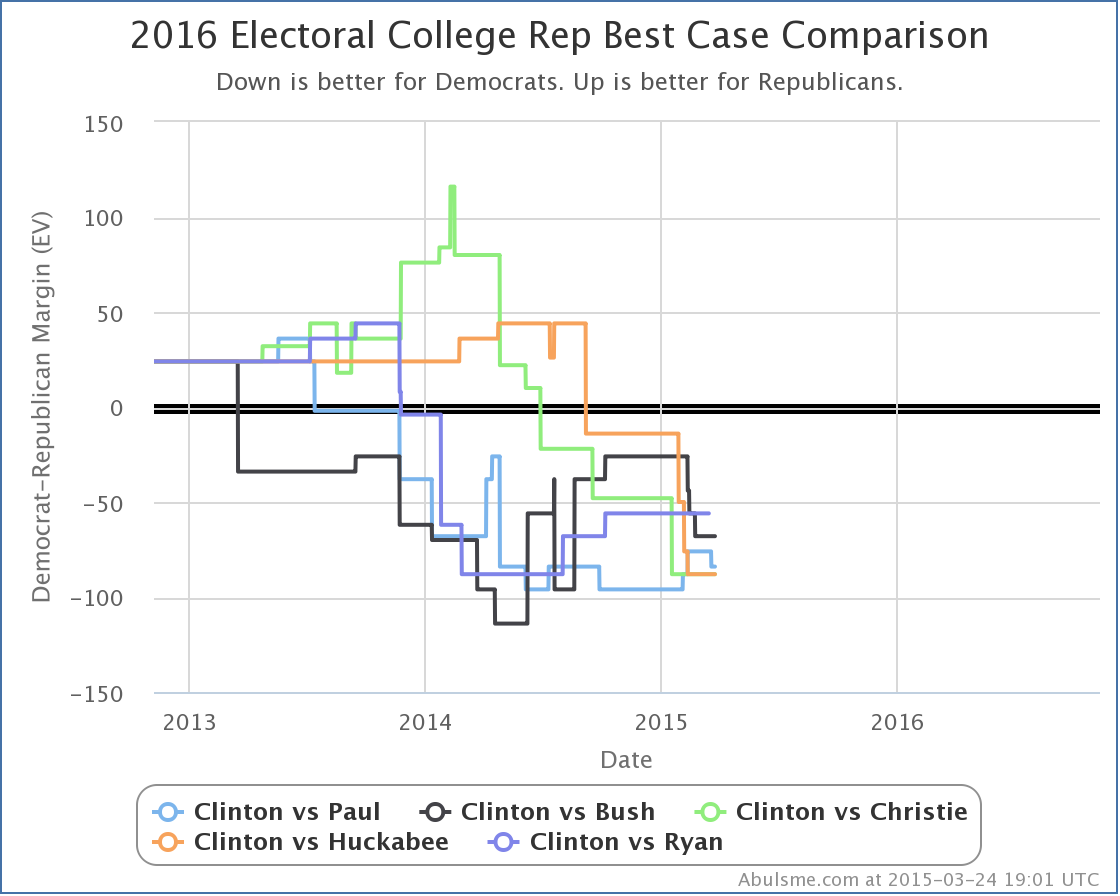
Looking at Paul’s “best case” as compared to the rest of the “5 best polled” combinations tracked here:
Since the November elections, Paul has improved his “best case” position from losing by 96 electoral votes, to losing by only 84 electoral votes. Bush, Christie and Huckabee meanwhile have actually all had their best cases get worse in this timeframe. (Ryan has held steady, but has said he isn’t running and hadn’t been polled much.)
What about Cruz you say? Didn’t he just announce? And Walker? He’s still getting lots of buzz! Or maybe even Rubio? Well, the polling on those combinations still isn’t that great and don’t make my top five. But they are improving. Right now Clinton vs Cruz is the 6th best polled combo, Clinton vs Rubio is at #7, and Clinton vs Walker is at #8. You can click through on those links if you want to see what those look like at the moment. But the amount of state level polling on those guys still isn’t that great, so take what you see there with a big lump of salt.
(And if you go even deeper and look at combos with non-Clinton Democrats, bring a whole wheelbarrow of salt.)
Note: This post is an update based on the data on my 2016 Electoral College Analysis Site. All of the charts and graphs seen here are from that site. Graphs, charts and raw data can be found there for the race nationally and in each state for every candidate combination that has been polled at the state level. In addition, comparisons of the best polled candidate combinations both nationally and each in each state are available. All charts above are clickable to go to the current version of the detail page the chart is from, which may contain more up to date information than the snapshots on this page, which were current as of the time of this post.


[Blog Post] “Electoral College: New Hampshire swings away from Paul again” http://t.co/sJu5WJEpYV