There were six states where the average margin over the last five presidential elections was less than 5%. Those states were Nevada, Ohio, Florida, Colorado, Virginia and Missouri. Since the 2012 election we’ve had lots of 2016 general election match up polls in Ohio, Florida, Colorado and Virginia. But nothing in Nevada or Missouri. No polls at all.
Today I added the first Nevada results for the 2016 cycle, a recent poll from Gravis.
The only category change coming out of this was for Clinton vs Bush.
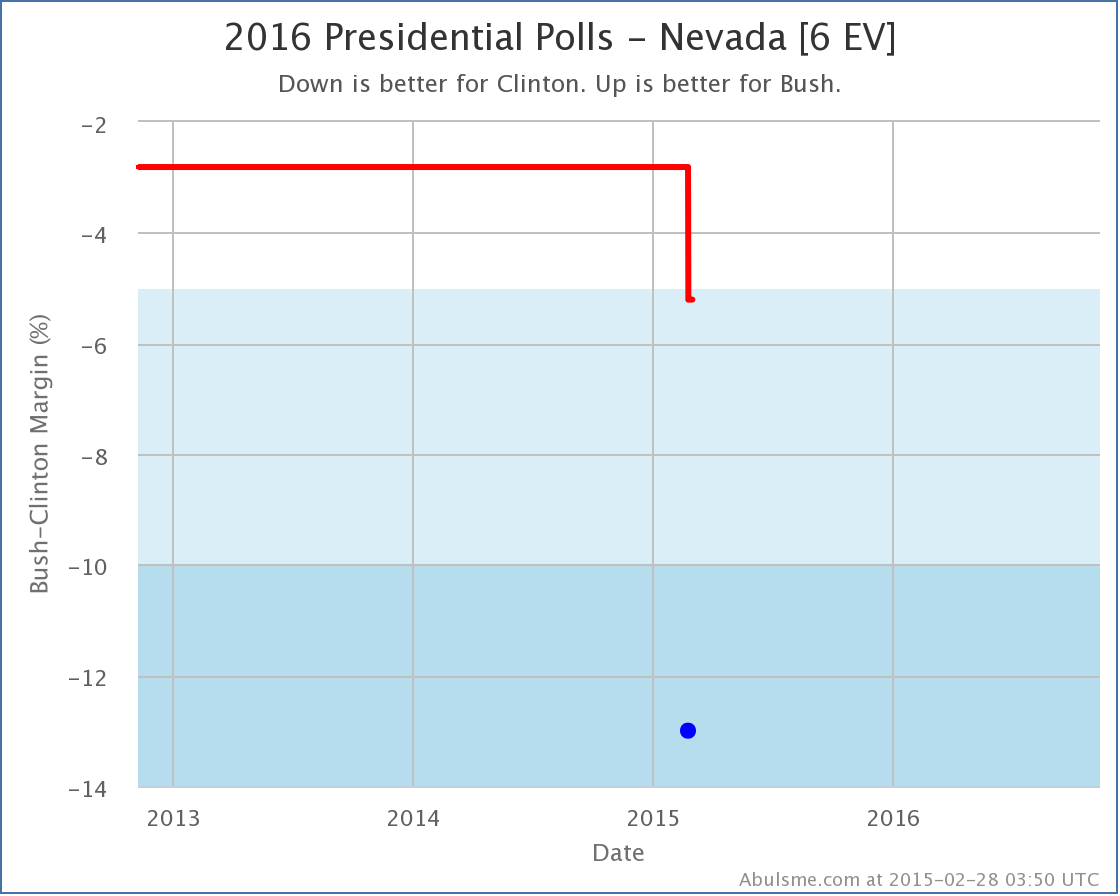
The margin over the past five elections in Nevada had ranged from the Republican by 3.5% (in 2000) to the Democrat by 12.5% (in 2008), but the average was Democrats by 2.8%, which gave Nevada an initial classification of “Weak Clinton”.
Gravis polled five different Republicans against Clinton. One of them (Sandoval) actually beat Clinton. The rest lost, and generally by a worse margin than the old average, but not by enough to push the average into a new category. Bush on the other hand did VERY badly in this poll, losing to Clinton 50% to 37%, or a 13% margin.
As the first actual head to head polling in Nevada, we’re still basing things primarily on old presidential election results, but that bad a result was able to single handedly move the the average to a 5.2% Clinton lead, and thus moved Nevada into the “Strong Clinton” category.
According to my simple model, this takes the state out of the list of possible Bush wins. At least for now… Perhaps this poll is an outlier and the next poll will make the state closer again. With one real poll, you wouldn’t want to feel too confident of what this stare really looks like quite yet.
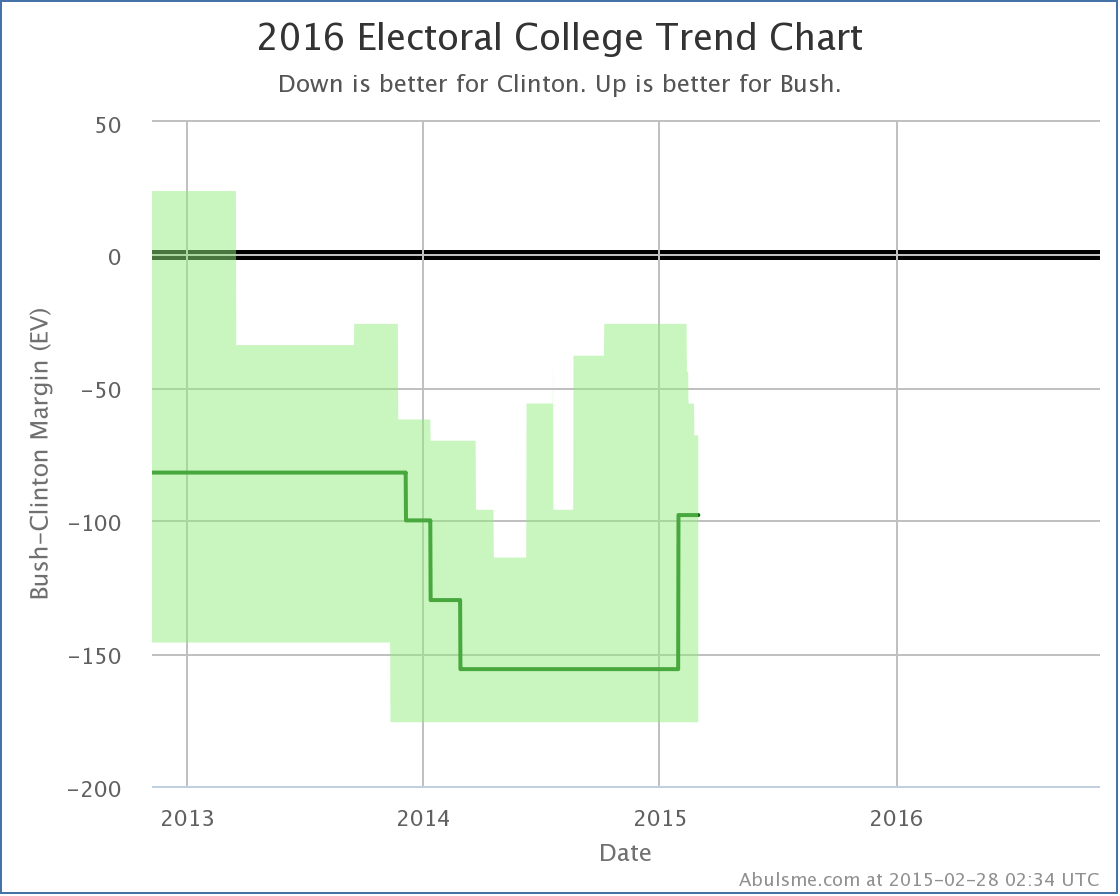
For now though, this of course further lowers Bush’s “best case”:
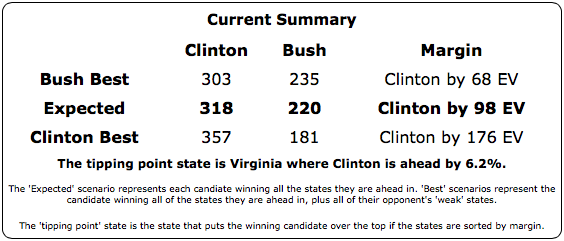
This makes the full national summary for Clinton vs Bush look like this today:
Now, this doesn’t look great for Bush, but he may start improving in Nevada (and other states) as we start getting into real campaigning. Maggie Haberman is reporting in the New York Times that the first TV ads specifically targeting Clinton will air this weekend. These of course will not be the last. It will not be surprising to see things move toward the Republicans as this process gets into full swing.
And of course we still need polls in Missouri. :-)
So… stay tuned.
Note: This post is an update based on the data on my 2016 Electoral College Analysis Site. All of the charts and graphs seen here are from that site. Graphs, charts and raw data can be found there for the race nationally and in each state for every candidate combination that has been polled at the state level. In addition, comparisons of the best polled candidate combinations both nationally and each in each state are available.
[Edit 06:06 UTC to add note at end which will become standard on these update posts.]


[Blog Post] “Electoral College: Bush slips in Nevada too” http://t.co/HbH0lOENbH