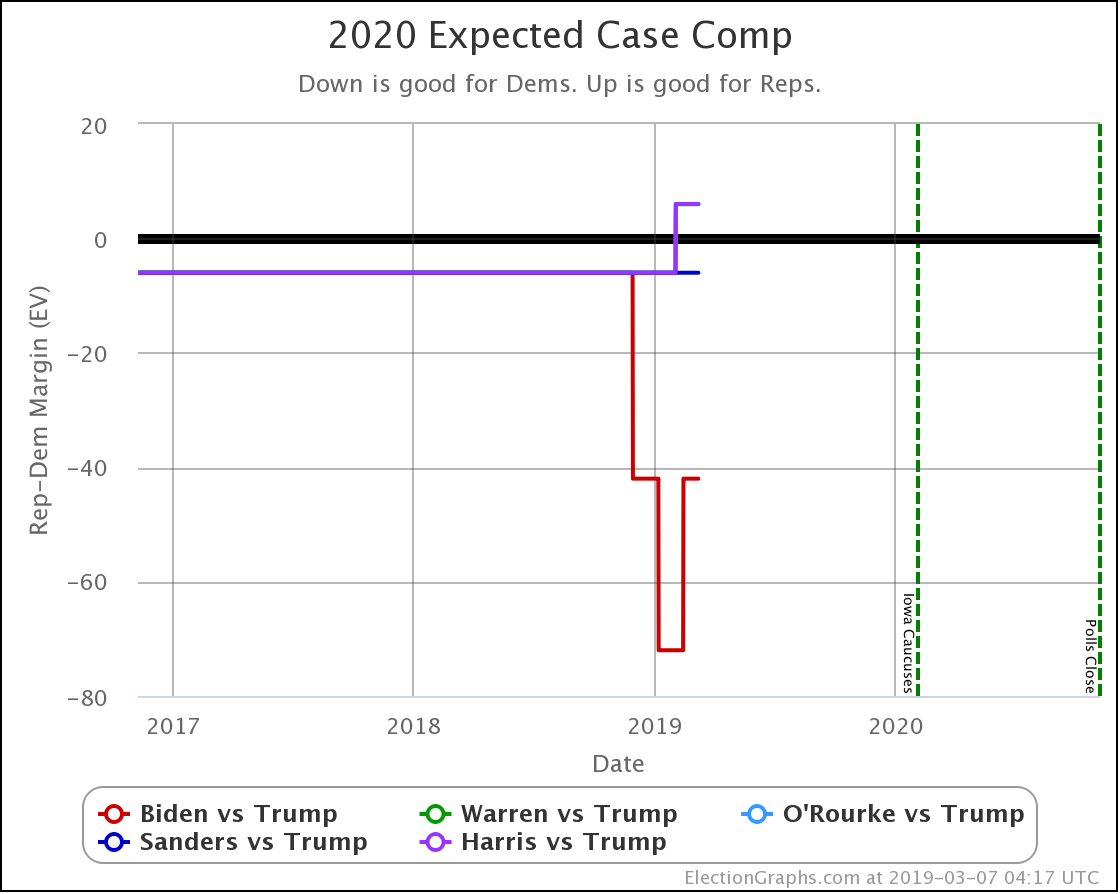
So, I mentioned a while ago that I wouldn’t be posting here regularly about developments over on my site Election Graphs. And I won’t. But I did want to mention that although I’m about four months later than I had wanted to be, and I haven’t yet made some of the changes and additions I have been thinking about, Election Graphs 2020 is now live and up to date with the sixteen 2020 state polls that have already been released, and I’ll be continuing to update it as new polls are released.
Recent highlights:
- 2019-01-27: Polling Averages vs Reality – The first in a six-part series looking at how polling averages compared to actual election results in the last three election cycles. (Links to the other five posts in the series are in the first post.)
- 2019-03-03: The 2020 Starting Line – A post looking at the average state by state election results for the past five cycles (2000-2016) to try to define what the “starting line” for the 2020 race looks like. This places each state where it would be based on this nearly 20-year history.
- 2019-03-08: The First 2020 Polls – The kick off for actually looking at real polls for 2020, pitting various Democrats against Trump. The main theme so far… based on the very limited polling so far, Biden does better against Trump than the other four of the five “best polled” Democrats. (That would be Warren, O’Rourke, Sanders, and Harris.)
At this point, as new polls come in, I’ll be updating the Election Graphs Electoral College 2020 page regularly as new polls come in, and when there are notable changes, I’ll be doing blog posts on the main Election Graphs page.
That kind of stuff is now over there, not here, so if you want it, you either need to be checking ElectionGraphs.com itself, subscribe to it with an RSS reader (RSS link), follow @ElectionGraphs on Twitter, or like and follow Election Graphs on Facebook.
Hope to see some of you over there!
