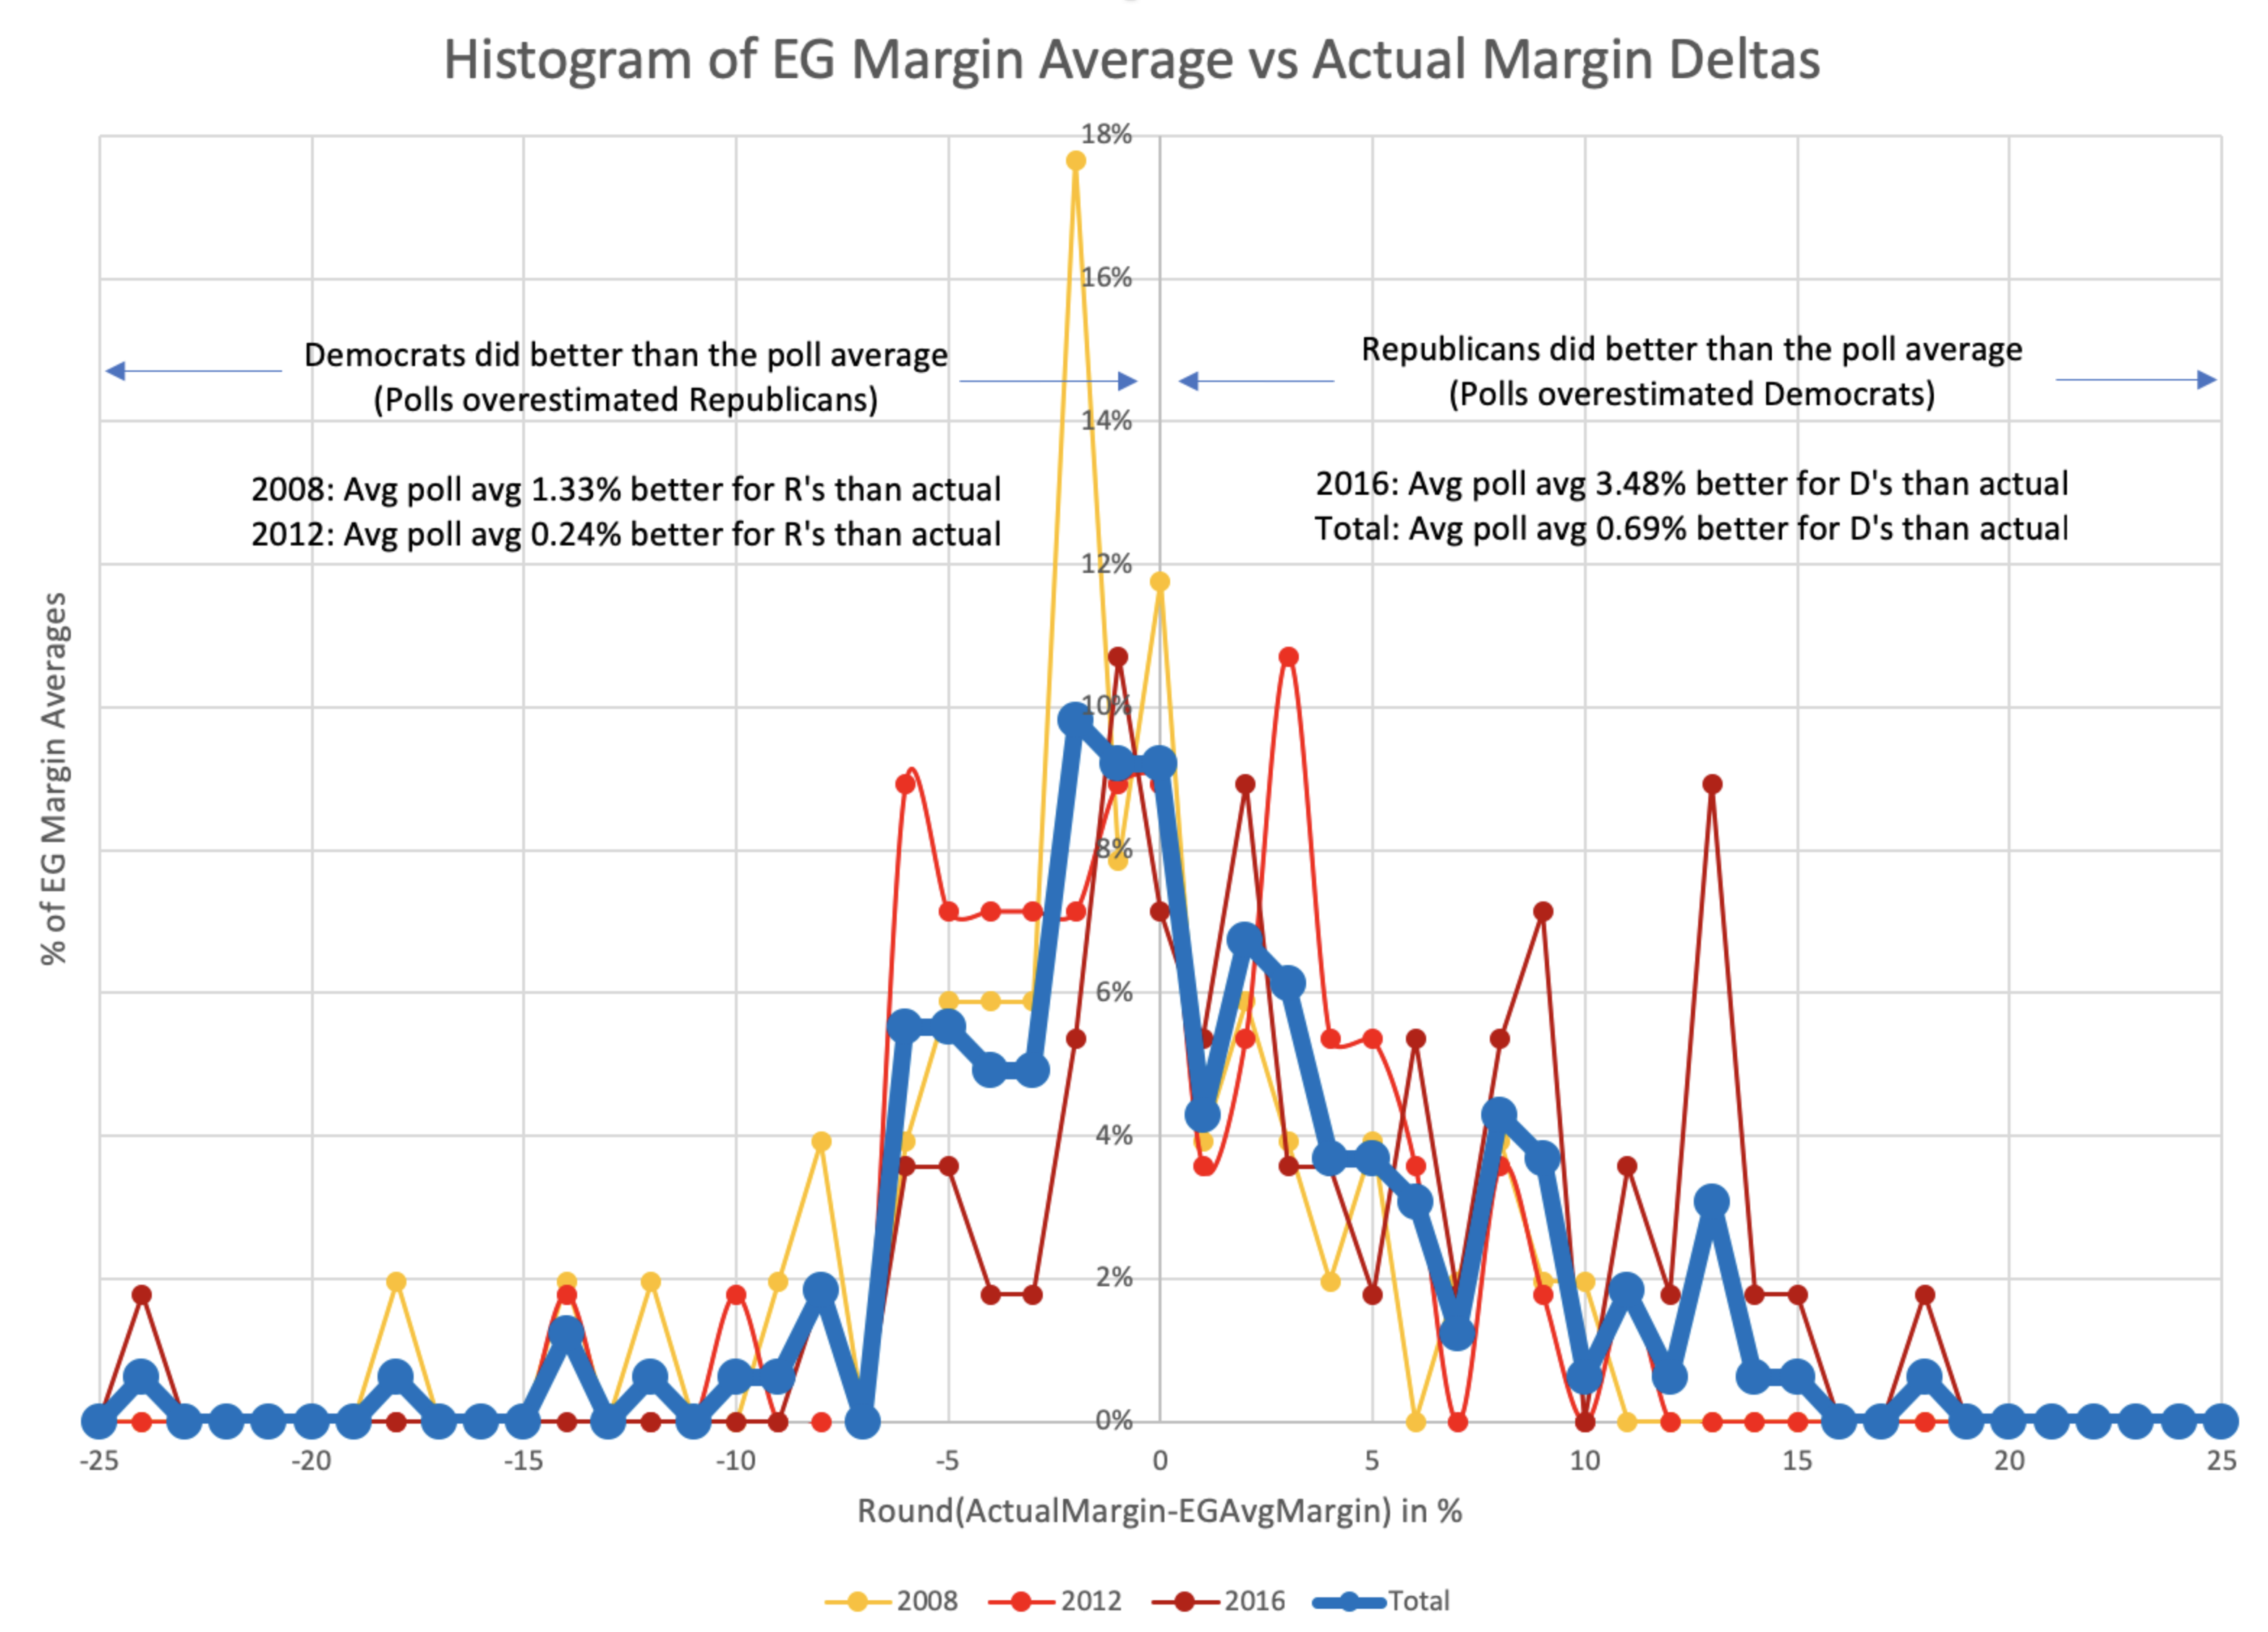
This week I’ll finally be doing some election geek posts over at ElectionGraphs.com with some analysis of the difference between the final state poll averages I had in 2008-2016 and the actual election results.
I just posted the first one a few minutes ago.
That kind of stuff is now over there, not here, so if you want it, you either need to be checking ElectionGraphs.com itself, subscribe to it with an RSS reader (RSS link), follow @ElectionGraphs on Twitter, or follow Election Graphs on Facebook.
This is still analysis of old stuff. New stuff for 2020 will be coming soon, but not quite yet. I will probably post again here once that actually starts. But if you want my “election stuff” follow one of the above…
One preview graph from the first of this series of posts…

Leave a Reply
You must be logged in to post a comment.