- 00:21:59 Listening to Song Exploder Peter Bjorn and John – Young Folks
via iCatcher! https://t.co/EZYvkYMruG - 01:07:57 Reading – Trump’s Abuse of Trump Foundation — Criminal Tax Implications? (Philip Hackney) https://t.co/5c8C6Sk501
- 01:09:35 Retweeted @mattyglesias 00:44:02 Unlike the rest of the press @TimOBrien has seen Trump's tax returns https://t.co/y1EV6Kambh https://t.co/yJBerMvfPc
- 01:22:26 Retweeted @hominidviews 01:17:04 If the election was held today, Hillary Clinton would beat Donald Trump with a 92.5% probability.… https://t.co/oapI9cJGCU
- 04:47:49 Reading – CO2 Levels Rise Above 400 PPM: You Will Never See Lower Again! (Cliff Mass) https://t.co/KfcWMFJ0Tr
- 12:09:10 Retweeted @AtticusGF 11:58:15 You know what Assange thought his killlshot was? His entirely unverified claim that Clinton wanted to drone him. Nobody cared or realized it
- 13:11:04 Ha ha ha! -> Trump backers realize they’ve been played as WikiLeaks fails to deliver October surprise (Griff Witte) https://t.co/B6XdNYJ2Qf
- 16:06:42 Retweeted @PatrickRuffini 13:40:23 Today is a fitting day to remember that Trump announced Pence as an afterthought and tried to get out of picking him the night before
- 16:35:18 Reading – Subpoenas and Gag Orders Show Government Overreach, Tech Companies Argue (Perlroth/Benner) https://t.co/xAiGpn9kmb
- 16:54:28 Retweeted @AliceOllstein 16:35:35 .@GovGaryJohnson just told @MSNBC that his lack of geographical knowledge is a plus bc you can't get into a war w/ a country you can't find
- 17:34:21 Reading – Yahoo secretly scanned customer emails for U.S. intelligence (Joseph Menn) https://t.co/jZzKa7riQ3
- 17:42:30 Retweeted @rubycramer 17:22:06 Yesterday in Michigan, Bill Clinton met a man whose grandfather knew his grandfather in Hope, Ark. "I almost wept,"… https://t.co/5P9HsFr9Be
- 19:04:32 Retweeted @edbott 18:33:19 Trump campaign surrogate plans visits to three swing states. https://t.co/kOuotg2bMq
- 20:02:12 Retweeted @ascheink 19:52:30 Allan Jarvis made a Twitter bot that posts updates: @electionbot538 in reply to ascheink
- 20:50:25 Retweeted @RayRiveraLive5 19:56:19 Afternoon models show 2 tracks heading out to sea. Asked Walsh if this is a possibility >>> "Not really" https://t.co/4HgemYQNRQ
- 21:20:39 Retweeted @iiPracticalJoke 21:18:08 @abulsme What do you think the odds of Minnesota flipping to the Trump side based on the polls on @ElectionGraphs.
- 21:24:51 .@iiPracticalJoke Very unlikely. In the last 2wk there have been a couple polls showing it close but avg has never been closer than C+4%. in reply to iiPracticalJoke
- 21:26:52 .@iiPracticalJoke That puts it in my “Weak Clinton” category for now, but realistically something big would have to change to flip it. in reply to abulsme
- 21:29:19 .@iiPracticalJoke And I see an Ipsos MN poll I haven’t entered yet (hopefully tonight) with C+8%. in reply to abulsme
- 21:33:49 Retweeted @ChrisMegerian 21:32:26 Clinton slips and says it's 35 years, not 35 days until the election.
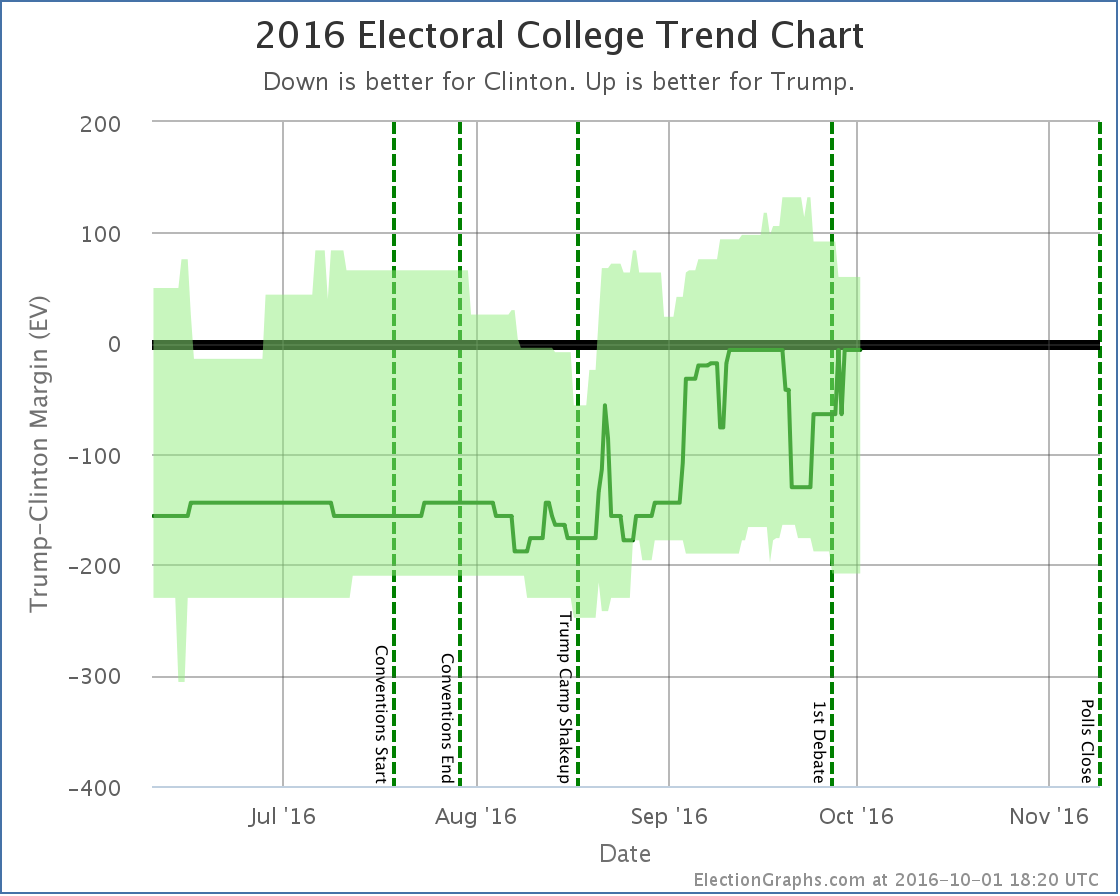
States with new poll data added since the last update: New Jersey, Florida, Nevada, Michigan, New Hampshire, California, Massachusetts. National SummaryThe newest batch of polls… mostly post-debate polls… results in movement toward Clinton and away from Trump, which matches the consensus expectations after the debate this week:
Looking at the charts:
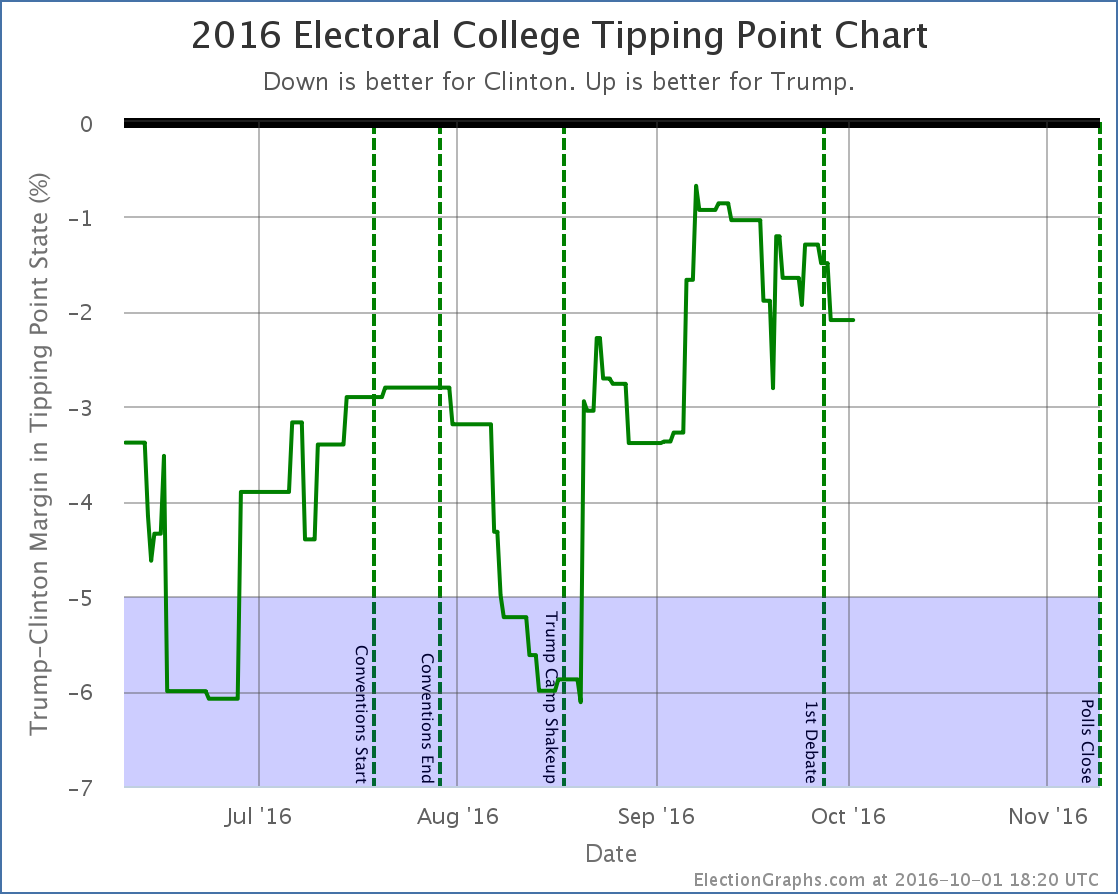
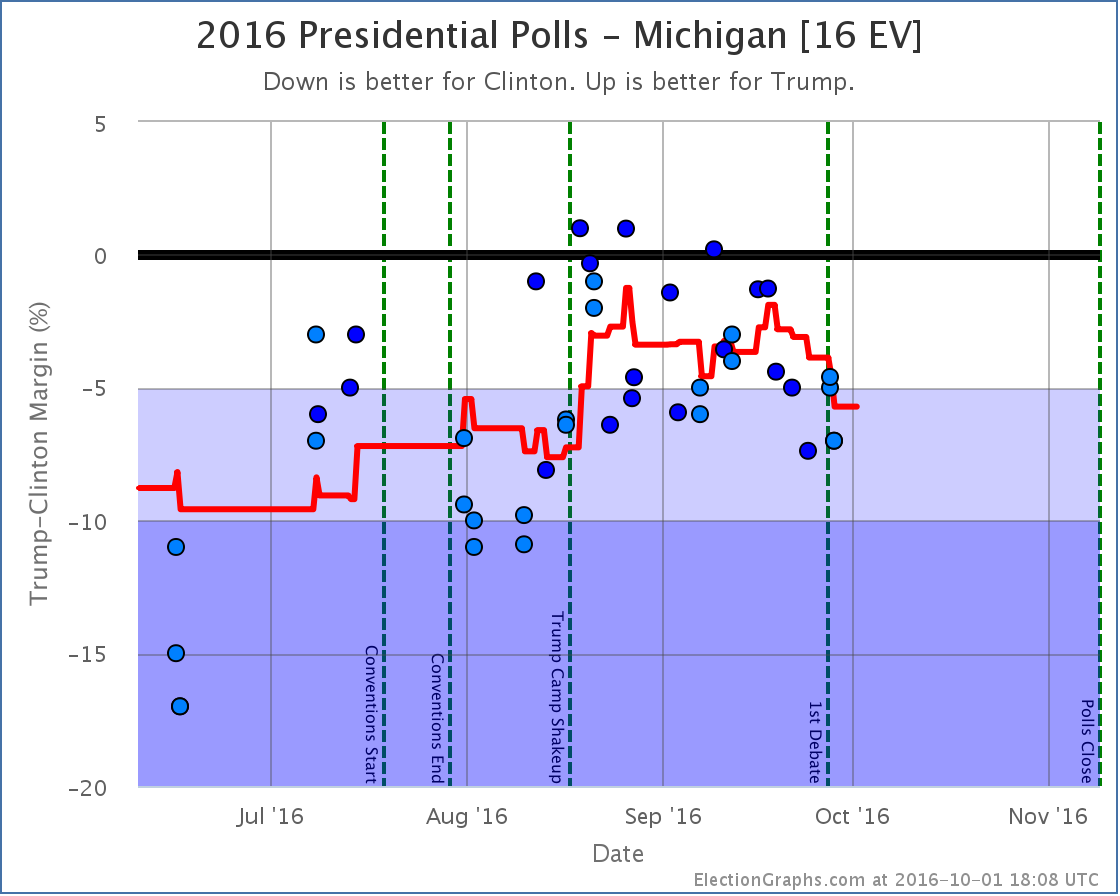
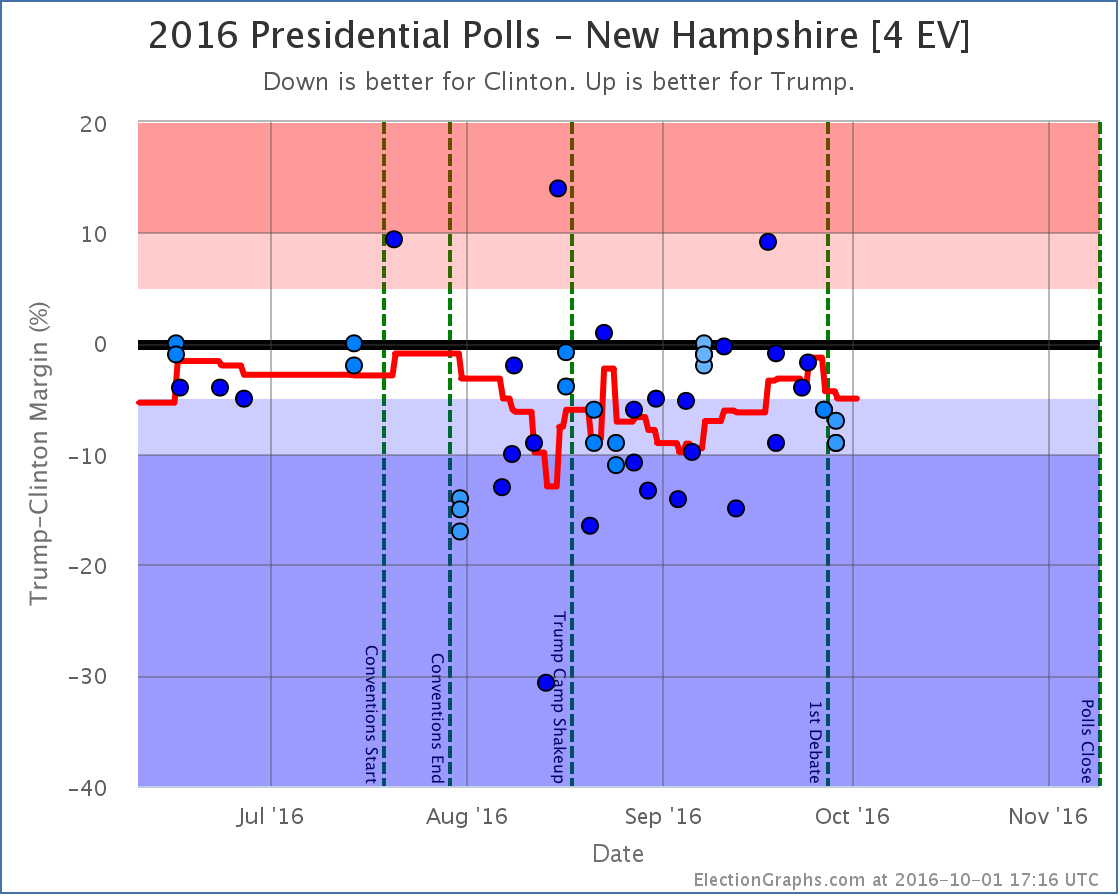
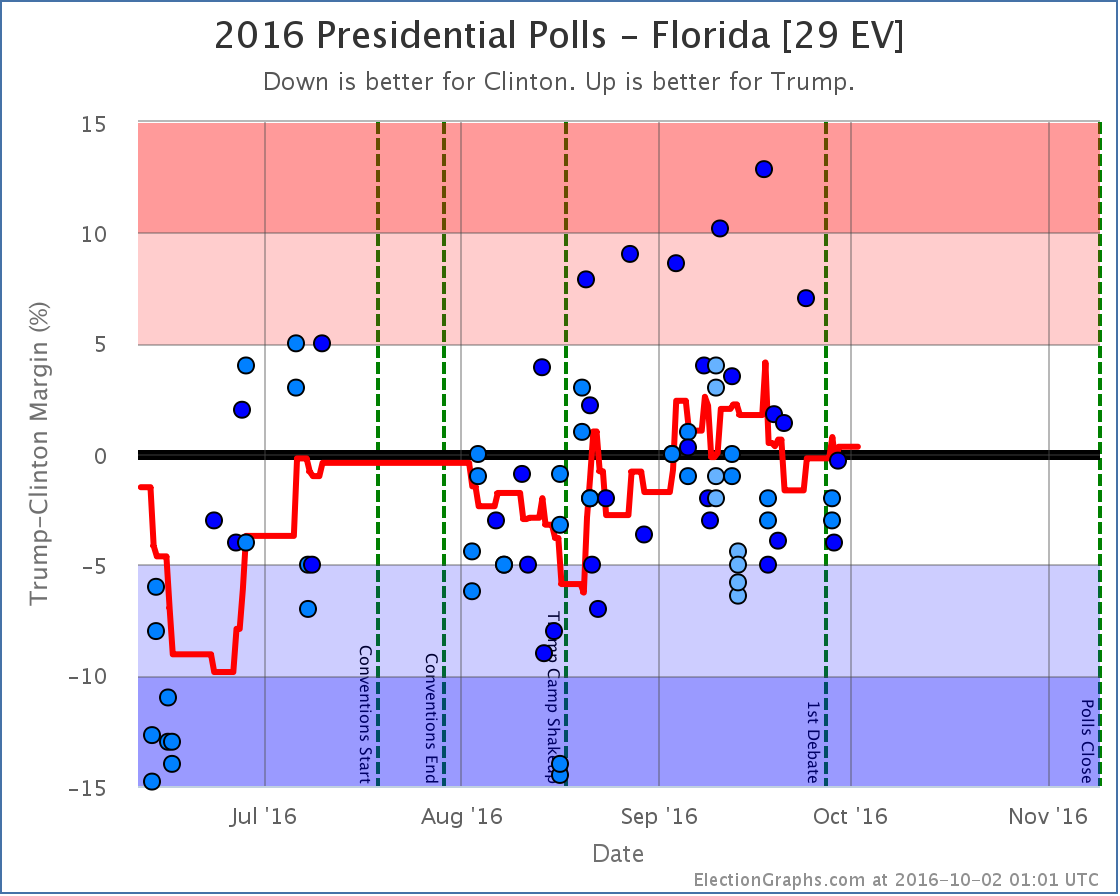
Although polls may still come in that change the shape of the last couple weeks, right now a clear pattern is emerging where both “best cases” have been moving in Clinton’s direction since about September 20th. More states are coming into Clinton’s potential reach, while other states are moving out of Trump’s reach. Interestingly, the “expected” case, although it has fluctuated as big states move back and forth across the center line, is back at the same place it was in mid-September… Clinton leading by an extremely narrow 6 electoral votes. But there are six states where the average shows Trump leading by less than 0.5%… North Carolina, Nevada, Kansas, Ohio, Florida, and Iowa. Even if you don’t believe Kansas (I am personally dubious about that one), that means there are 74 electoral votes where Trump is hanging on by a thread. If more polls pull those five non-Kansas states away, his expected case drops all the way to an 154 electoral vote loss. Things look very close in the electoral college right now, but that could change in a hurry! The volatility of the electoral college measure means to really judge how “close” the race is, we’d be better off looking at the tipping point: Although the tipping point also has ups and downs as states move around, there is a trend here too. Trump peaked on September 7th when Clinton was ahead by only 0.7% (in Nevada). Since then, Trump has been losing ground. With the latest post-debate drop, Clinton’s lead in the tipping point state (now Colorado) is up to 2.1%. At the moment Trump only has to flip Colorado to be in the lead. And a 2.1% lead is not a huge margin there. This is still close. Just not at close as it was. So far the post-debate moves actually look more like a continuation of trends that started earlier rather than a big change caused by the debates, but even after five days, most of the close states just have a small number of post-debate polls, so we may not be seeing the complete picture yet. 37.9 days, 2 presidential debates, and 1 VP debate left to go until polls start to close… State DetailsAll the state level details for those who want to dig in… Weak Clinton to Strong ClintonThe poll average in Michigan has been moving toward Clinton since September 18th. With the latest update, which included two separate post-debate polls, Clinton’s lead increases to 5.7% which moved the state out of reach for Trump, leading to the reduction of his best case mentioned above. Didn’t change categories, but moved the tipping pointWeak Trump to Weak Clinton then back againWith the latest batch of polls Florida moved from just barely Trump to just barely Clinton, then moved right back again. As this round ended, Florida ends up with an 0.3% Trump lead. The bottom line with Florida is it has been “close” for all but a few days since the conventions ended. Unless we start seeing a definitive movement in one direction or another, Florida remains “too close to call”. Having said that, Trump has been boosted by outlier Google polls. In the chart above, EVERY poll showing Trump with a lead more than 5% has been a Google poll. Those polls really do look like outliers. If you took Google out, Clinton would be maintaining a small but clear lead in Florida… but we include everything, and so Florida is still hovering right around the zero line. For more information…This post is an update based on the data on ElectionGraphs.com. Election Graphs tracks both a poll based estimate of the Electoral College and a numbers based look at the Delegate Races. All of the charts and graphs seen in this post are from that site. Additional graphs, charts and raw data can be found there. Follow @ElectionGraphs on Twitter or like Election Graphs on Facebook to see announcements of updates or to join the conversation. For those interested in individual general election poll updates, follow @ElecCollPolls on Twitter for all the polls as they are added. If you find the information in these posts interesting or useful, please consider visiting the tip jar.
|
||
