- 07:54:27 Retweeted @ElecCollPolls 07:53:35 That’s all for now. New polls in FL/PA/WI/OH/AK. Notable change in AK, so @ElectionGraphs post a little later.
- 17:12:41 [Blog Post] Electoral College: Alaska in play? https://t.co/BuCGcM97El
- 17:35:45 Retweeted @gelliottmorris 17:15:47 @ElectionGraphs no https://t.co/z6tsw462Nf in reply to ElectionGraphs
- 17:37:33 .@gelliottmorris Like the site! You’re not including the latest ASR or Moore polls? (I understand not including Google. :-) in reply to gelliottmorris
- 17:39:48 Retweeted @gelliottmorris 17:39:07 @ElectionGraphs forecast probably hasn't adjusted yet. It pulls everything from https://t.co/eGNNVkEVER, they have 2 update their end first in reply to ElectionGraphs
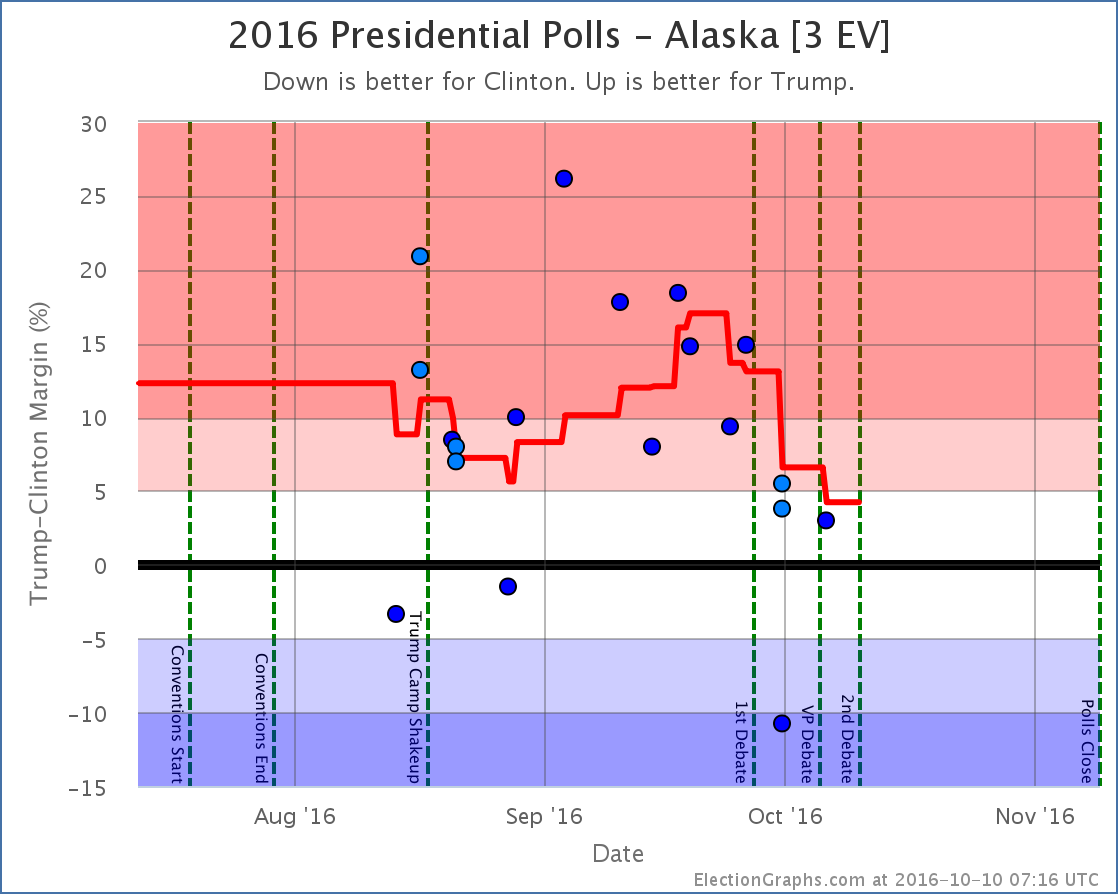
- 17:41:58 .@gelliottmorris Trump is still clearly a favorite in AK, but the post debate polls show him a lot weaker. Your odds will shift with those. in reply to gelliottmorris
- 17:43:28 .@gelliottmorris That is tenuous though, so it may not last. Only two non-Google post 1st debate polls so far. AK not heavily polled. :-) in reply to ElectionGraphs
- 21:30:10 Retweeted @gelliottmorris 20:50:26 @ElectionGraphs just seeing this. Your forecast will bounce back once you get a non-google poll. Alaska is redder than lean Trump/ swing in reply to ElectionGraphs
- 21:33:29 .@gelliottmorris As mentioned in post, lots of caveats. No surprise if T lead >5% again soon. But post-debate polls show closer than before. in reply to gelliottmorris
- 21:36:15 .@gelliottmorris I see I have one new AK poll in queue to add tonight. It will bump my AK avg from 4.2% to 4.8%. Still under 5%, but barely. in reply to ElectionGraphs
- 21:37:26 .@gelliottmorris That is CVoter though which I know you exclude along w/Google. I try to include everything, but the outliers drive me nuts! in reply to ElectionGraphs
- 21:40:49 .@gelliottmorris Right now w/o Google I’d be at T+9.1%. With new CVoter but no Google, would be at T+9.8% With no CVoter OR Google, T+6.6%. in reply to gelliottmorris
- 21:41:16 Retweeted @gelliottmorris 21:38:09 @ElectionGraphs Yeah, -Cvoter & Google I’m at Trump +6. 93% win chance https://t.co/z6tsw462Nf https://t.co/0mx6lijo3y in reply to ElectionGraphs
- 21:42:59 .@gelliottmorris With no Google, no CVoter, but only post 1st debate polls though, T+3.8%. in reply to ElectionGraphs
- 21:43:21 Retweeted @gelliottmorris 21:42:40 @ElectionGraphs Are you connecting to a database online? which one? in reply to ElectionGraphs
- 21:44:46 .@gelliottmorris All manual data entry. :-) You can get my raw data in machine readable form here though: https://t.co/IssmhtsJVx in reply to gelliottmorris
- 21:47:04 .@gelliottmorris Iviews with me and two other “independent” trackers about methods on my podcast fr a few weeks ago: https://t.co/y7BmKWb9qU in reply to ElectionGraphs
- 21:47:39 .@gelliottmorris I didn’t know about your site then, or I would have invited you too. :-) in reply to ElectionGraphs
- 21:48:28 Retweeted @gelliottmorris 21:48:04 @ElectionGraphs I’d be happy to join you next time! I’ll take a listen in my spare time in reply to ElectionGraphs
- 21:48:46 .@gelliottmorris Thanks! Enjoy the next 29 days! :-) in reply to gelliottmorris
- 21:50:00 Retweeted @gelliottmorris 21:49:43 @ElectionGraphs Thanks! Just for you, I’m going to re-run my forecast w/ CVoter polls to see the impact. Last time the outliers rlly skewed in reply to ElectionGraphs
- 21:51:02 .@gelliottmorris It will be interesting. But in my opinion Google has the biggest outlier problem! It pains me every time I add them! :-) in reply to gelliottmorris
- 21:52:02 Retweeted @gelliottmorris 21:51:28 @ElectionGraphs My advice: stop adding them! GIGO in reply to ElectionGraphs
- 21:53:50 .@gelliottmorris Part of site’s philosophy is include just about everything. Asking 4 trouble to change criteria mid-stream. Maybe 2020. :-) in reply to gelliottmorris
- 22:03:03 Retweeted @gelliottmorris 21:53:42 CVoter shifted probabilities by following:
AK 4%
AZ 13
VA 14
etc, etc
Not even going to go through w/ full model update. waste of my time - 22:03:06 Retweeted @gelliottmorris 22:02:19 @ElectionGraphs meant to tweet this to you, whoops in reply to gelliottmorris
- 22:11:08 Retweeted @gelliottmorris 21:34:14 @ElectionGraphs Gotcha. Im on board with race-tightening rhetoric re: republican states in reply to ElectionGraphs
- 22:11:09 Retweeted @gelliottmorris 21:37:04 @ElectionGraphs Take out Google and you’re at what, 7? in reply to ElectionGraphs
- 22:11:18 Retweeted @gelliottmorris 21:42:24 @ElectionGraphs Alright. Like I said, for Alaska I only have three polls al they’re at least a month old. Really ne… https://t.co/bQacbIZhNE in reply to ElectionGraphs
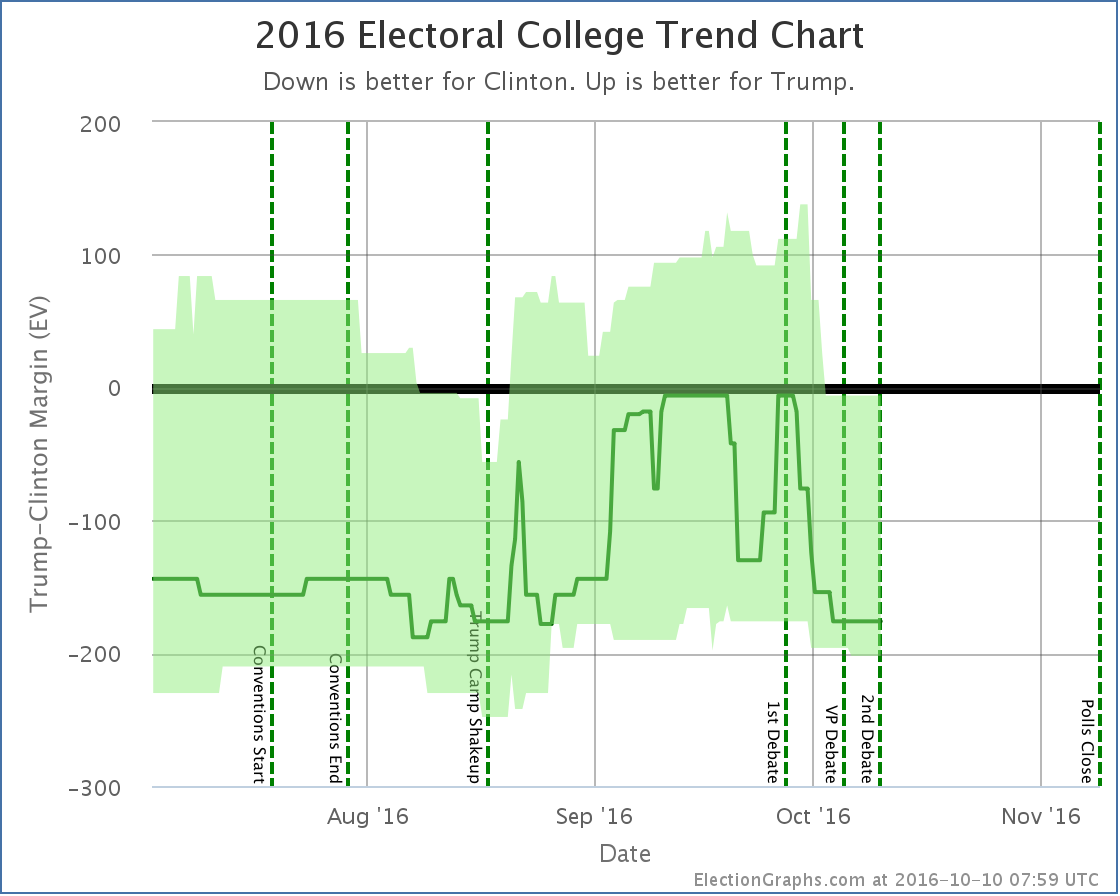
States with new poll data added since the last update: Florida, Pennsylvania, Wisconsin, Ohio, Alaska Notable changes in: Alaska National SummaryOnly one change this time, but it it continues to be movement toward Clinton. The most recent polls included here now ended Friday, but it is unclear how much, if any, they were impacted by the 2005 Trump tape, since that happened later in the day on Friday.
The chart: Clinton’s best case has been improving slowly since mid-September. She has a bit to go before she matches her peak in August, but if the current trends continue, we may see that again within a week or so as the impacts from the 2005 Trump tape and the second debate start to be visible in the state polls. 9.3 days until the next debate. 29.3 days until we start getting actual election results. We are in the final stretch. State DetailsMoving into play for ClintonAlaska has been moving away from Trump for the last couple of weeks. With the latest additions, Trump is now up by only 4.2%. So it moves into the “Weak Trump” category. Now, big caveat here… This is heavily influenced by a Google poll showing Clinton up by 10.8%. Google has had strange outliers in many states this cycle, and this may well be one of them. So it is quite possible this won’t last as additional new polls come in. Without Google, Trump’s lead would still be at 9.1%. Having said that, there have been two non-Google polls since the first debate. If you only average those, you have a 3.8% Trump lead. Still in “Weak Trump” territory. So saying Alaska is looking much closer than it did is probably still quite fair. In any case, we have a policy of including just about everything, so the Google polls count, and so Alaska is at Trump +4.2% now, which is a narrow enough lead that the state is now a possible Clinton pick up. For more information…This post is an update based on the data on ElectionGraphs.com. Election Graphs tracks both a poll based estimate of the Electoral College and a numbers based look at the Delegate Races. All of the charts and graphs seen in this post are from that site. Additional graphs, charts and raw data can be found there. Follow @ElectionGraphs on Twitter or like Election Graphs on Facebook to see announcements of updates or to join the conversation. For those interested in individual general election poll updates, follow @ElecCollPolls on Twitter for all the polls as they are added. If you find the information in these posts interesting or useful, please consider visiting the tip jar.
States with new poll data added since the last update: Wisconsin, Florida, Ohio, Indiana, New Hampshire, Iowa, Virginia, Colorado, Alaska, Washington, Michigan, Arizona, Tennessee, Maryland, Massachusetts, Oregon, Illinois. Notable changes in: Michigan and Arizona. National SummaryAs of this update, the most recent polls included in the state averages ended on Thursday. That means that as of yet we do not have any polling that would show the impact (or lack thereof) of Friday’s release of 2005 era Trump recordings that have dominated the news since then. But even before those revelations, Trump was dropping quickly in the aftermath of the first debate and the leak of tax documents. This process continues:
Looking at the charts: Clinton expands her expected win by taking the lead in Arizona. But perhaps more notable at this point is that her lead in Michigan expands to 5.9%, moving it from my “Weak Clinton” category into “Strong Clinton”. Without Michigan, Trump no longer has a path to victory. He can win all the states he is ahead in, plus all the states where he is close (North Carolina, Arizona, Florida, Ohio, Iowa, and Nevada) and he would still come up short, losing to Clinton 272 to 266. In order to win, Trump would need to not only pull all of those close states over to his side, but also reverse his fortunes in Michigan or other states where he is currently not just behind, but significantly behind. Now, with all this, Trump’s numbers are actually still slightly better than he was doing at Clinton’s high water mark in mid-August. Trump came back from that and moved things to the point where he had almost tied the race. Can’t he do that again? Well, look carefully at that recovery. From Trump’s low point, it took about a month to reach the point where he had almost tied the race. A month. We now have 30.3 days left until polls start to close on election day. Many people have already voted. Early voting is ramping up quickly in state after state. In order to catch up and win, Trump would have to have a recovery that was more significant… and quicker… than the successes he managed in August and September. For any reversal, Trump has to pull out of the tailspin first… and the polls don’t yet reflect the latest major campaign events. Things are likely to get worse for Trump before they get better. If they get better. He is running out of time. It may already be too late. As I write this the 2nd Presidential debate is in just a few hours. Hang on tight. State DetailsHere are the charts for the states whose movements caused the summary changes: Weak Trump to Weak ClintonFour of the five polls in the average right now have Clinton tied or ahead in Arizona. All three post debate polls do. Clinton’s lead in the average though is a very narrow 0.3% though. Trump could very well take the lead again with the next poll. Weak Clinton to Strong ClintonMovement away from Trump is visible starting in mid September. Trump’s debate performance did nothing to change this trend. Clinton now holds a fairly substantial lead in Michigan. For more information…This post is an update based on the data on ElectionGraphs.com. Election Graphs tracks both a poll based estimate of the Electoral College and a numbers based look at the Delegate Races. All of the charts and graphs seen in this post are from that site. Additional graphs, charts and raw data can be found there. Follow @ElectionGraphs on Twitter or like Election Graphs on Facebook to see announcements of updates or to join the conversation. For those interested in individual general election poll updates, follow @ElecCollPolls on Twitter for all the polls as they are added. If you find the information in these posts interesting or useful, please consider visiting the tip jar.
|
||


