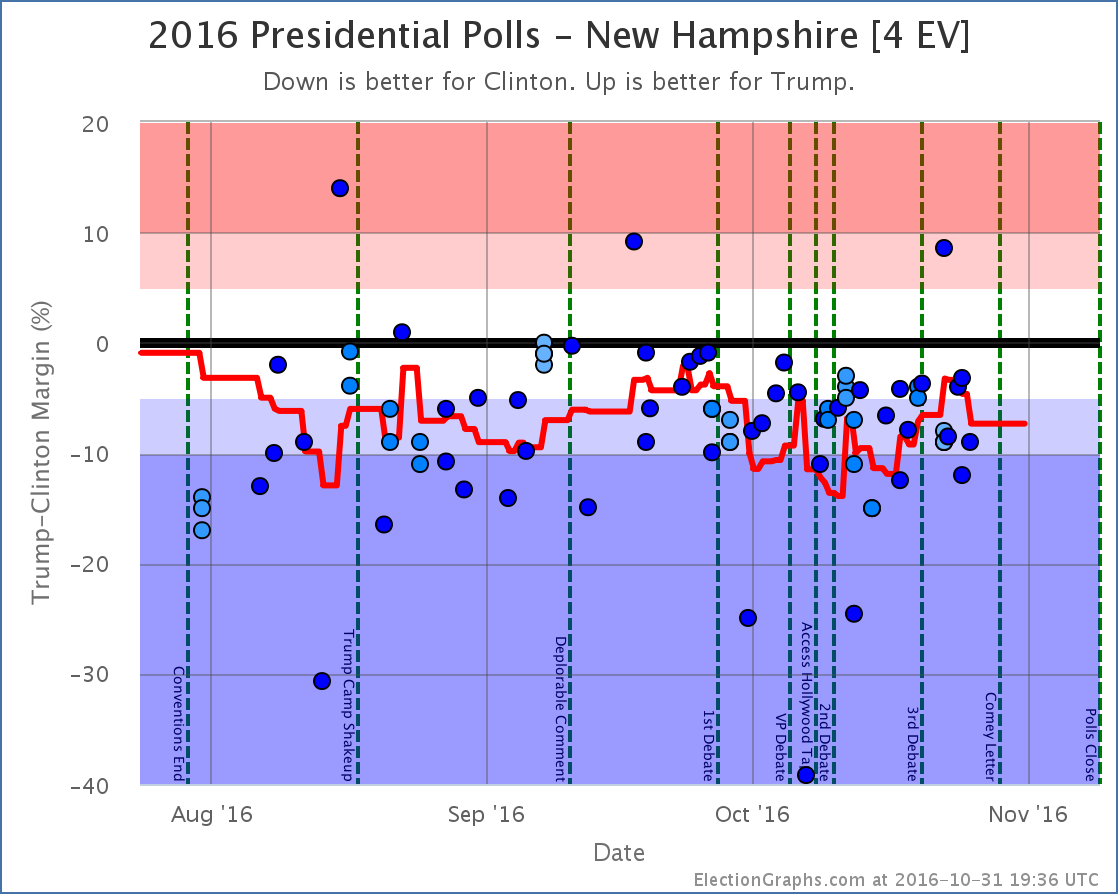
States with new poll data added since the last update: All 50 states, DC, and the Maine congressional districts.
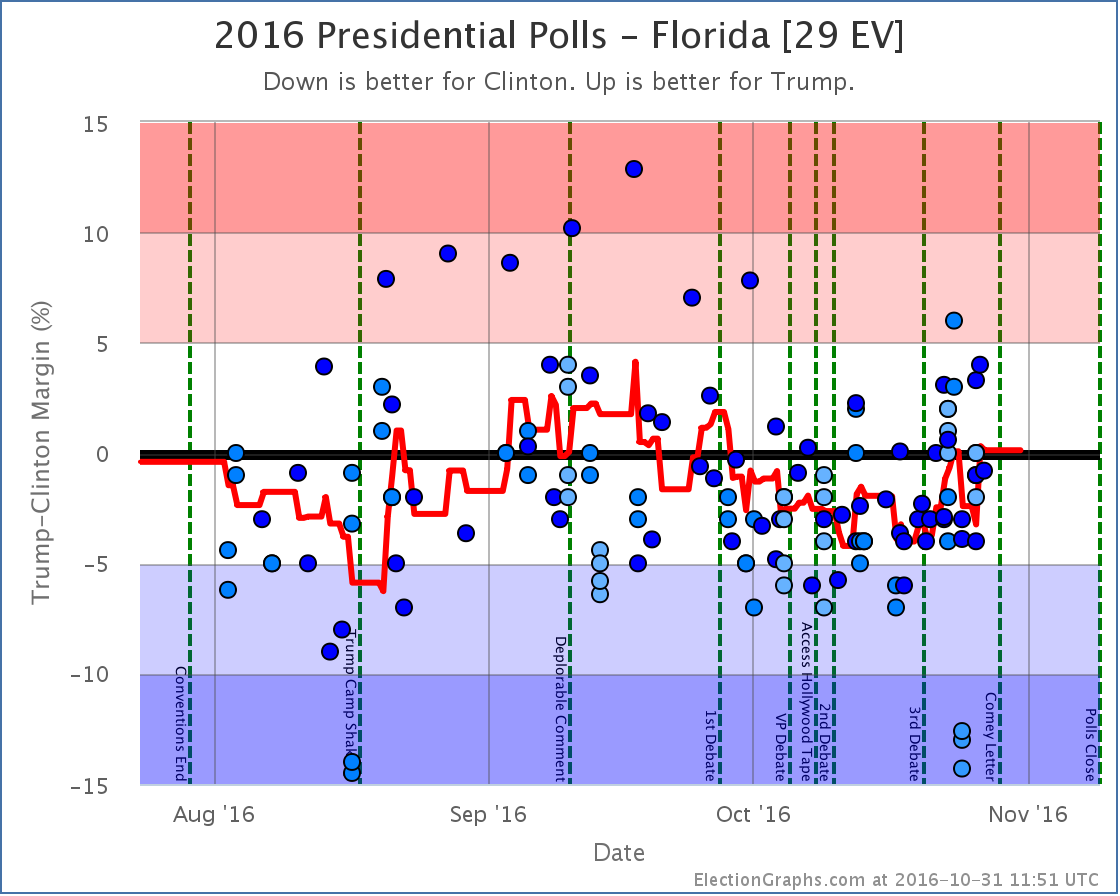
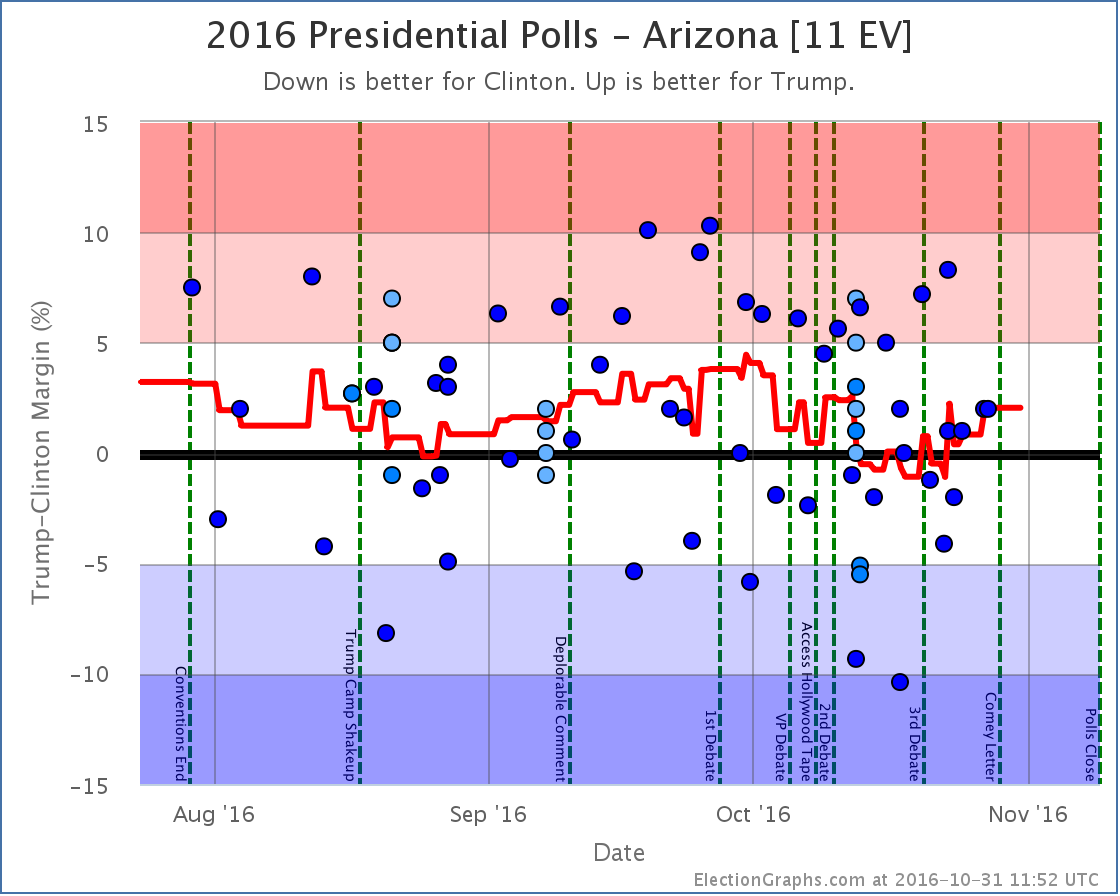
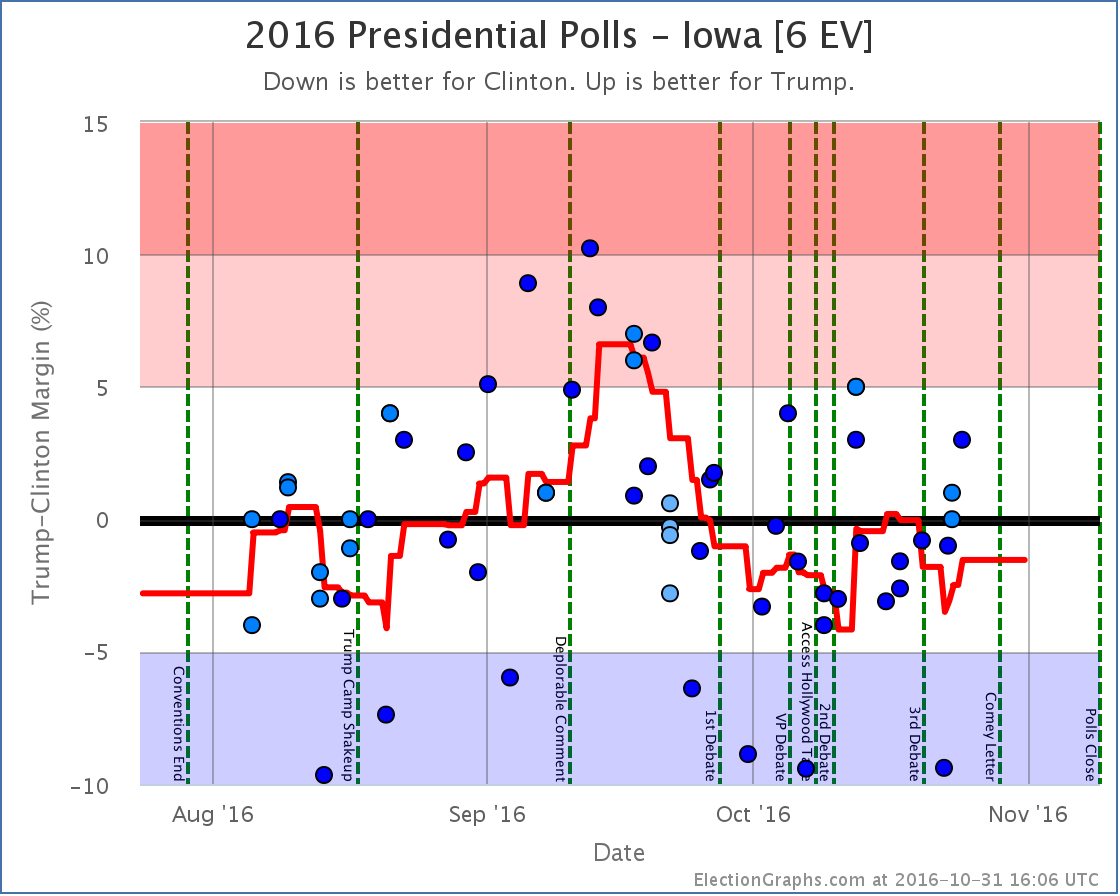
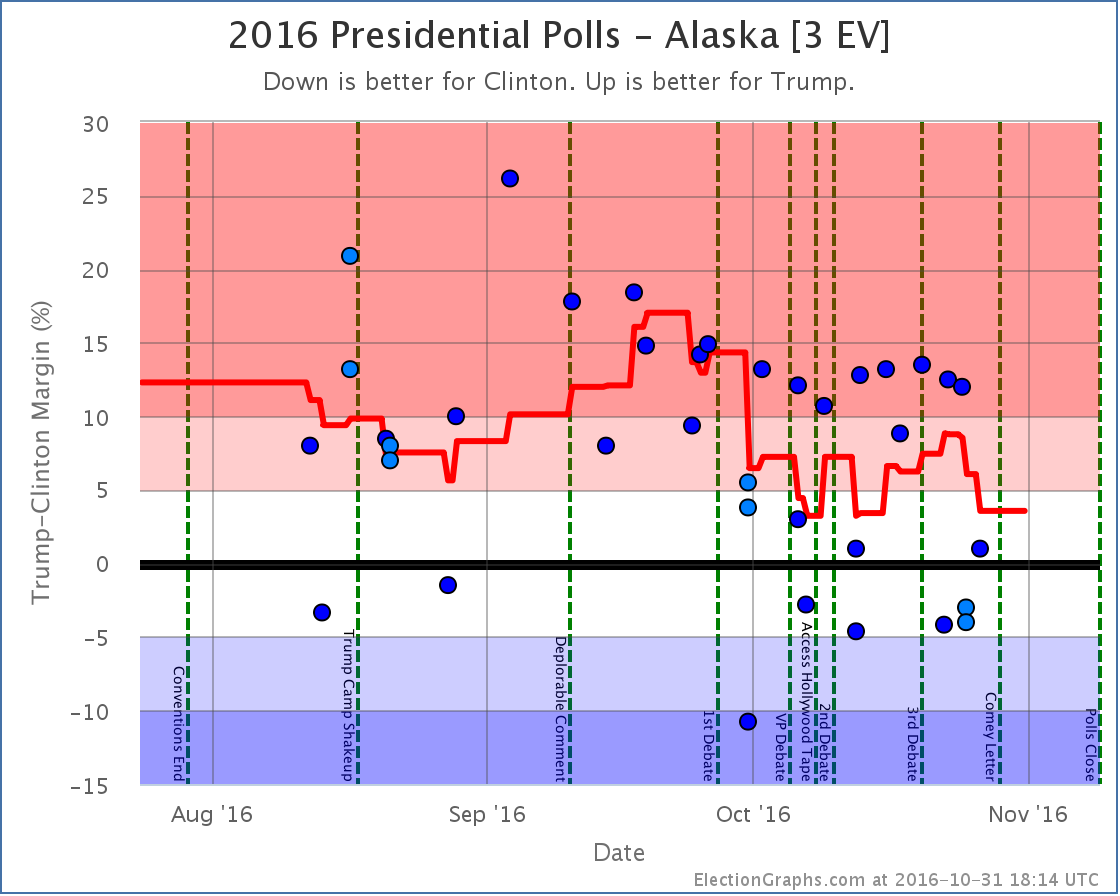
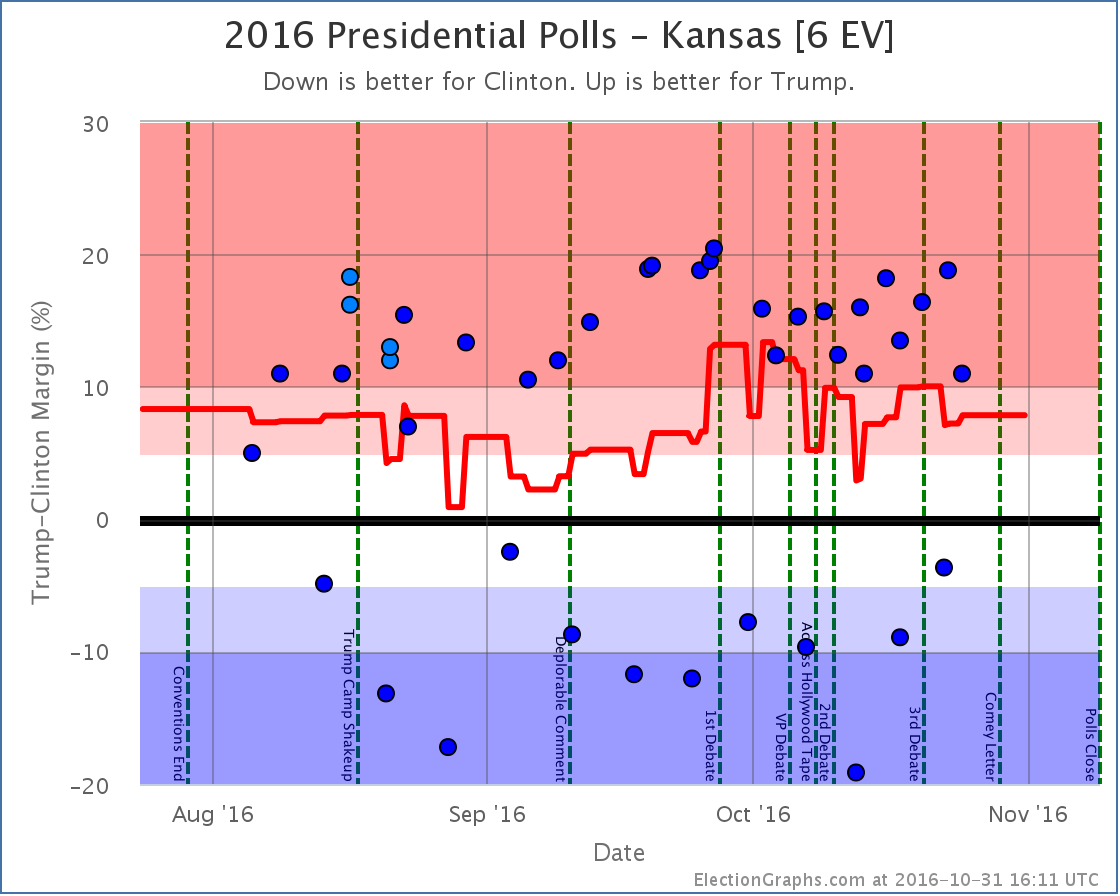
Notable changes in: Florida (29), Pennsylvania (20), Arizona (11), Iowa (6), Kansas (6), Utah (6), Alaska (3), and the tipping point.
National Summary
It has been about five days since the last update. Since then the movement has been decidedly mixed.
Note that as of this update, no polls have been included that contain interviews done after the release of the “Comey Letter”.
Good for Trump:
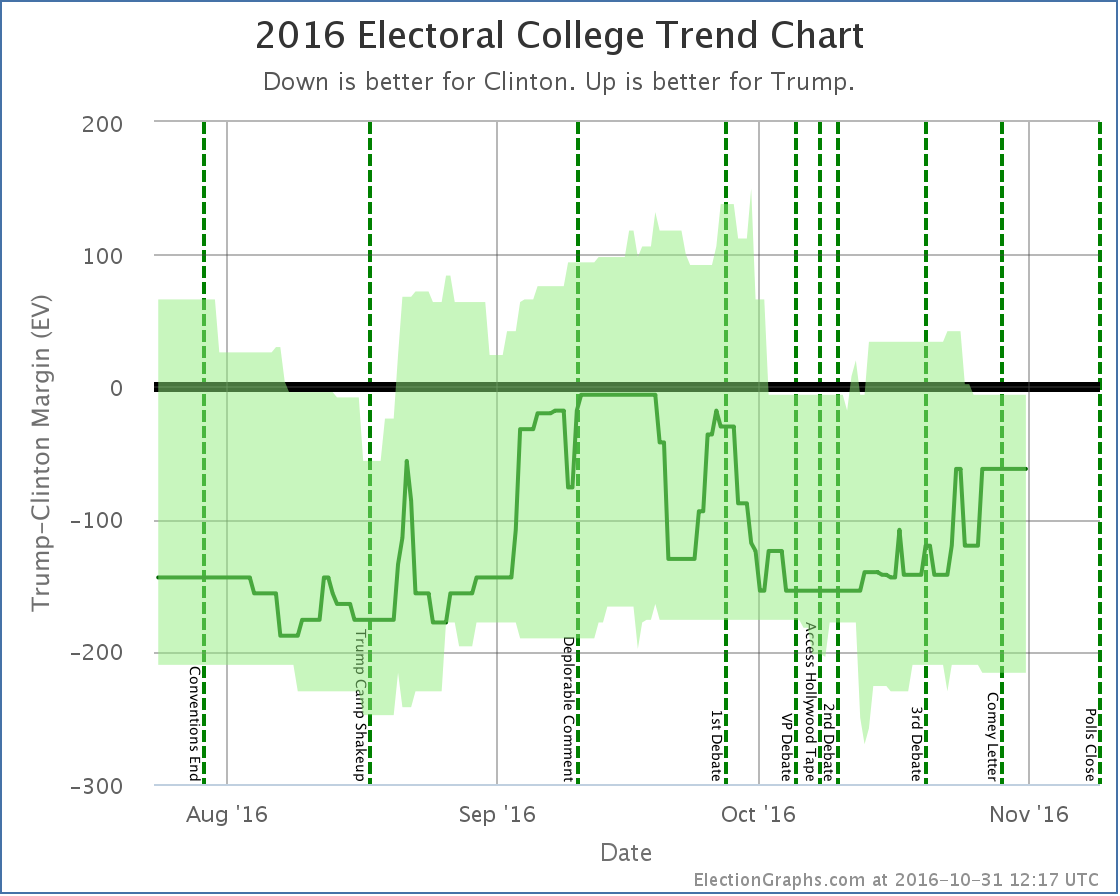
- The expected result has moved from a 130 EV Clinton win to only a 62 EV Clinton win
- Clinton’s best case has declined from a 234 EV win to only a 216 EV win
Good for Clinton:
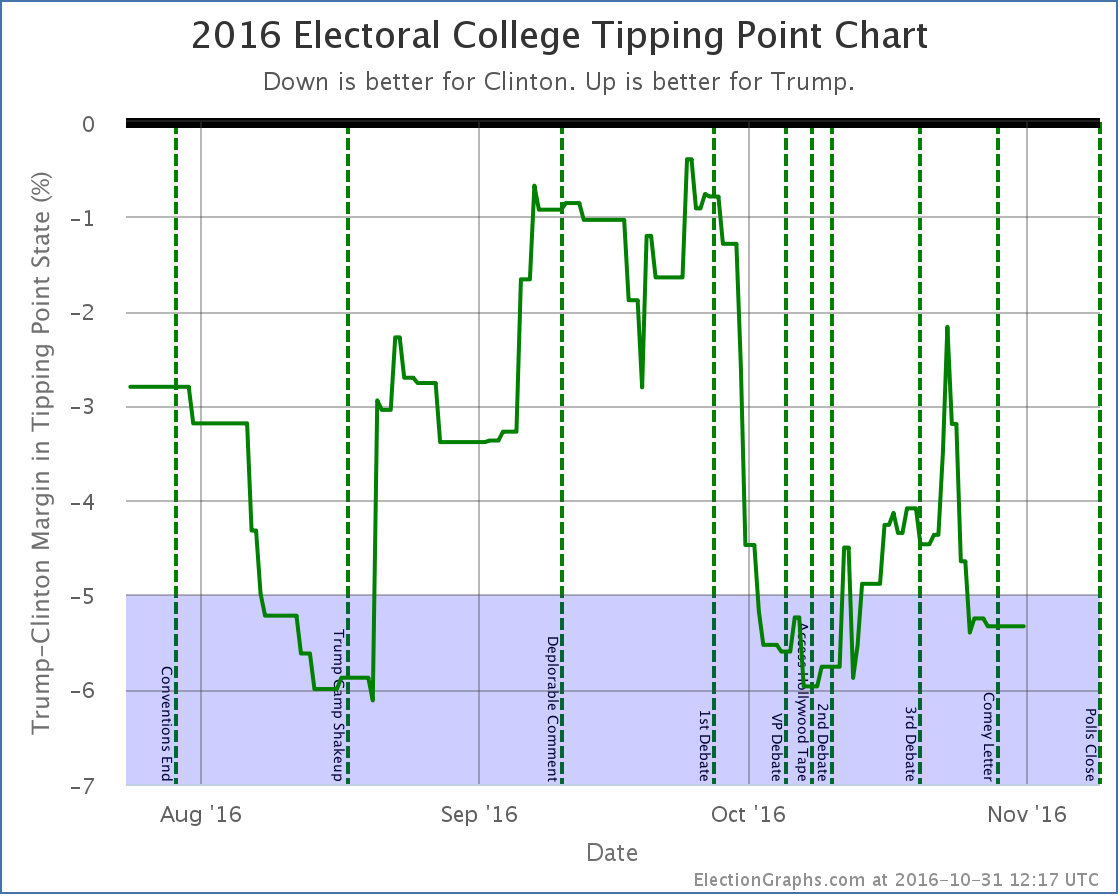
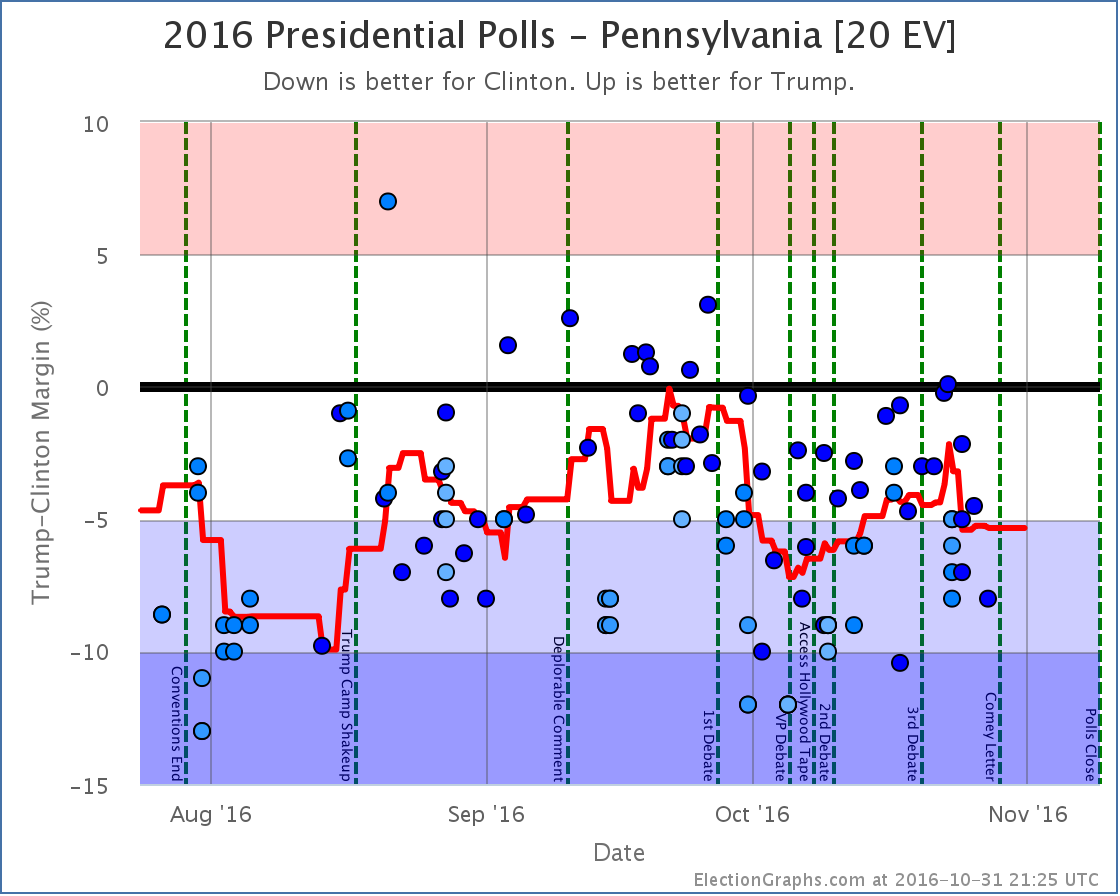
- The tipping point moves from Clinton by 4.1% in PA to Clinton by 5.3% in PA
- Trump’s best case declines from a 34 EV win to a 6 EV loss
Charts
Discussion
While some metrics have moved in Trump’s direction and others in Clinton’s, in the end this picture is bad news for Trump. Why is that? Fundamentally, doesn’t the fact that the “expected case” moved toward Trump mean that he is doing better?
Well, it means the margin he will lose by is getting smaller, yes. However, if you are trying to look for scenarios where Trump would actually catch up and win, the tipping point is what you want to be looking at. To win he has to move the tipping point state (or states he is even further behind in) over to his side of the line. And the tipping point is moving further away at the moment.
If you look at the tipping point chart you can see that Trump had indeed been making progress on the tipping point starting about when the Access Hollywood tape dropped. But that started to reverse around the 23rd. At the same time that his expected electoral college result was still improving.
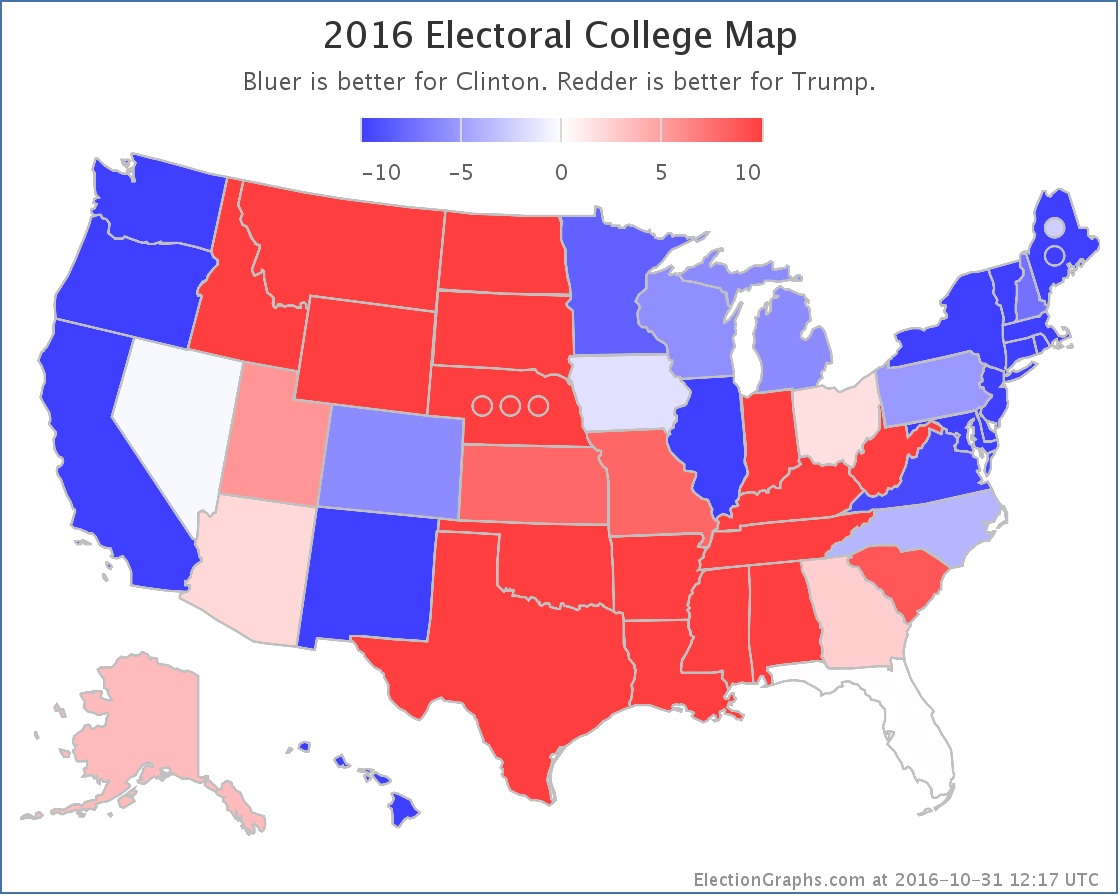
This is still confusing. What is happening? Well, all the states aren’t moving in lock step in reaction to events. A number of close states have moved toward Trump, like Florida for instance. But key states like Pennsylvania have been moving away from him. Because of this divergence, we can have Trump improving his electoral college “score” while simultaneously the path to 270 electoral votes gets harder.
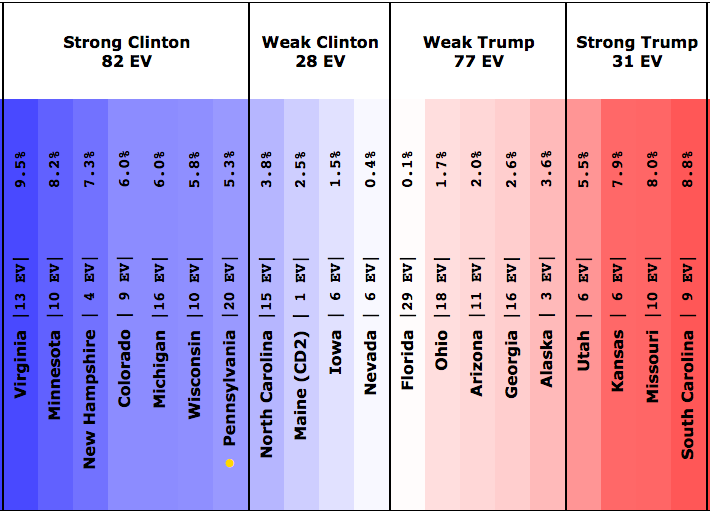
And in fact, at the moment, 270 looks out of reach for Trump. Look at the spectrum of the close states above. Right now Trump could win every state he is ahead in, then also pull over the states where he is close… Nevada (0.4% Clinton lead), Iowa (1.5% Clinton lead), Maine CD2 (2.5% Clinton lead), and North Carolina (3.8% Clinton lead)… and Trump would still lose by 6 electoral votes.
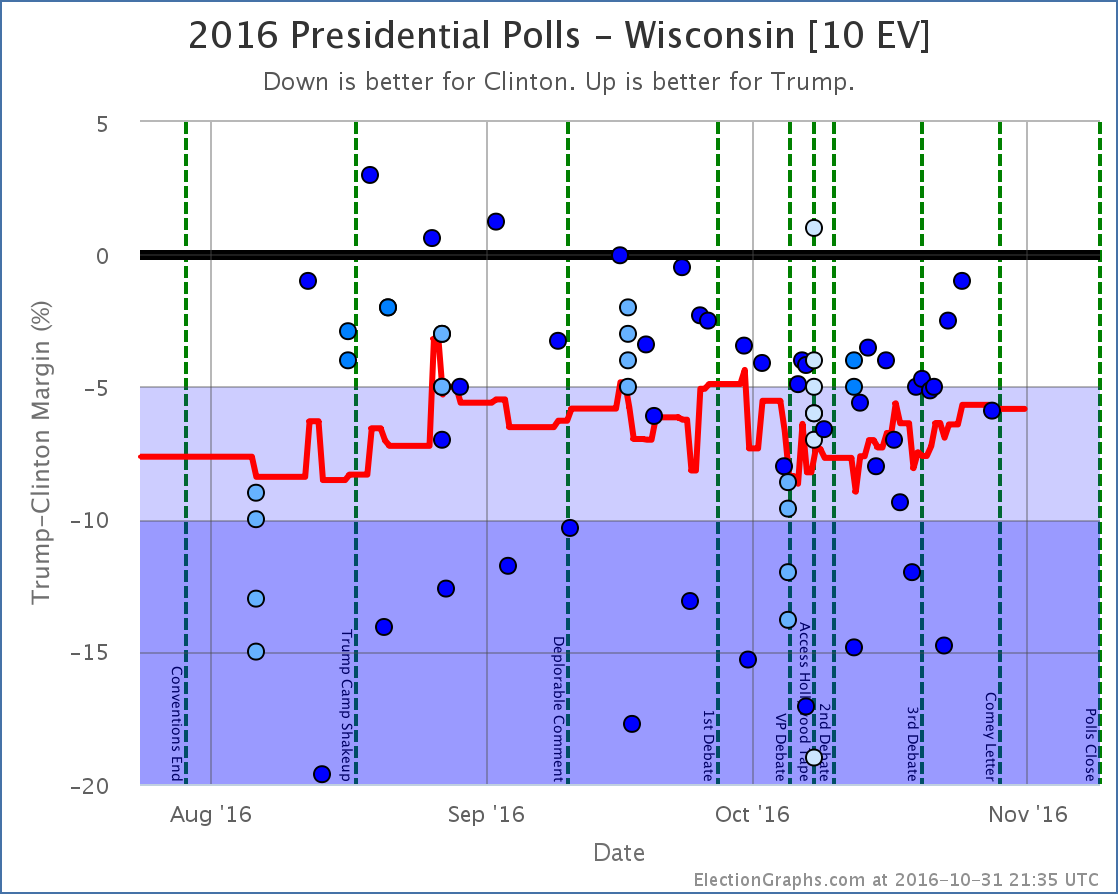
To win, Trump has to win all of the close states, plus Pennsylvania, where Clinton has a 5.3% lead at the moment… or one of the other larger “Strong Clinton” states… Wisconsin, Michigan, Colorado, Minnesota, or Virginia… all of which Clinton currently leads by even bigger margins. (New Hampshire isn’t enough to push Trump over the edge with only 4 EV.)
This is a really big pull with so little time left. The Trump side seems to be hanging their hopes on the fallout from the Comey Letter. This may cause some movement, but early indications are that almost all voters made up their minds on the Clinton email issue and if it mattered to them long long ago, and this is unlikely to change many minds.
We’ll start to see if there is any movement due to the letter within a few days. But there just are not that many days left. Sites that give odds for Trump winning range from less than 0.01% on the low side to 24.4% on the high side. The median odds seem to be around 5%. That isn’t impossible. But those odds are low enough that a Trump win would be a very big surprise.
There is another goal that Trump has a much better shot at though. If the election ends up exactly how things look today, Trump will lose by only 62 electoral votes. That would mean that Trump would do better than both McCain (lost by 192 EV) and Romney (lost by 126 EV). It may not be an actual win, but Trump improving on the performance of both previous Republican candidates may give the message to Republicans that a Trump like candidate in 2020 might be the way to go rather than returning to Romney or McCain style Republicanism.
We shall see.
8.1 days left until we start getting actual election results.
We are almost there.
State Details
The following are the detailed charts for all the states that influenced the national changes outlined above.
Moving from Clinton to Trump
Moving from Trump to Clinton
Now a possible Clinton pickup
Now out of Trump’s reach
Now out of Clinton’s reach
Also influencing the tipping point
A note about McMullin
Election Graphs is designed around showing the Republican – Democrat margin, and there is not enough time before the election to revamp the site to properly account for 3rd parties that are strong enough to have a shot at winning electoral votes.
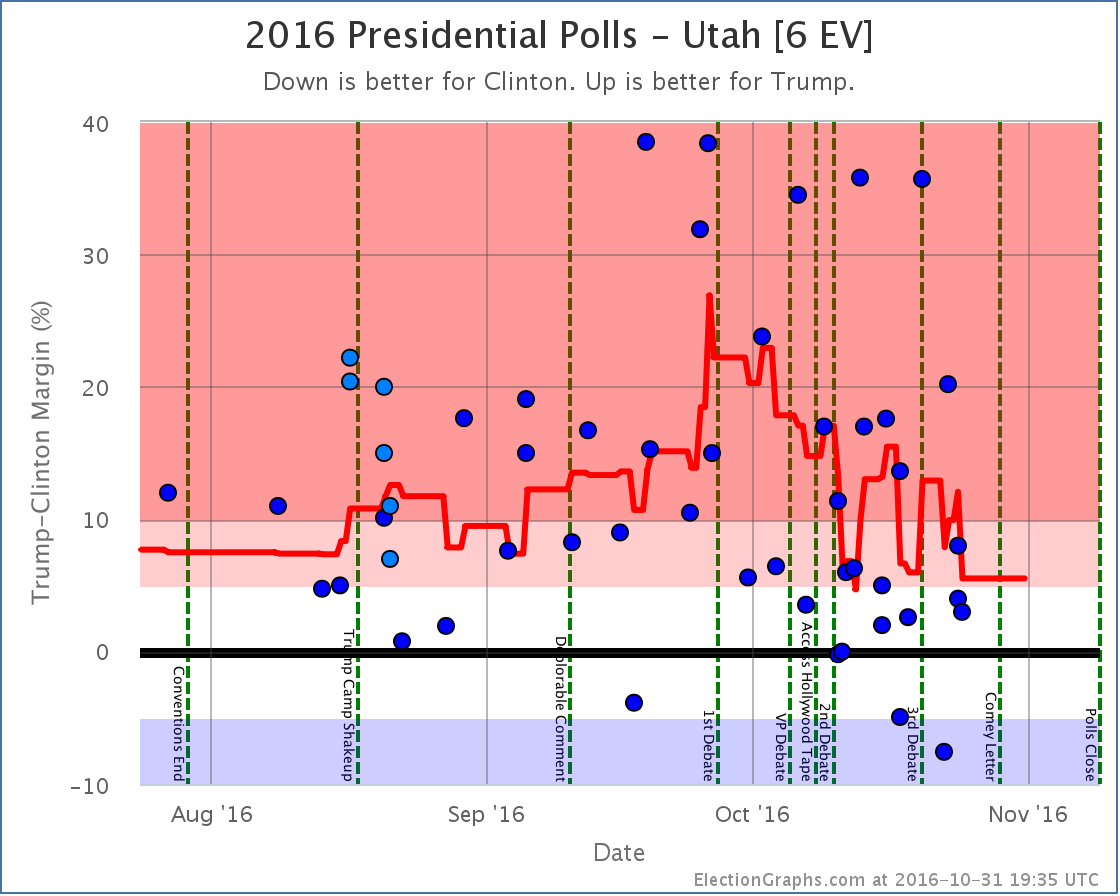
Right now the Real Clear Politics average in Utah has McMullin 6.0% behind the lead. The 538 average in Utah has him 7.3% behind the lead. If/when McMullin is within 5% according to either of these averages, I will add notes to both the Utah and National pages about the possibility of McMullin winning Utah’s 6 electoral votes.
For more information…
This post is an update based on the data on ElectionGraphs.com. Election Graphs tracks a state poll based estimate of the Electoral College. All of the charts and graphs seen in this post are from that site. Additional graphs, charts and raw data can be found there. Follow @ElectionGraphs on Twitter or like Election Graphs on Facebook to see announcements of updates or to join the conversation. For those interested in individual general election poll updates, follow @ElecCollPolls on Twitter for all the polls as they are added. If you find the information in these posts interesting or useful, please consider visiting the tip jar.
