- 02:51:29 Poll Added: PPP in NH from 2016-08-26 to 2016-08-28 – Clinton 46% to Trump 40% https://t.co/E3f8ME1ioq
- 03:02:16 Poll Added: PPP in AZ from 2016-08-26 to 2016-08-28 – Clinton 43% to Trump 46% https://t.co/shaWSinOLu
- 03:09:26 Poll Added: PPP in WI from 2016-08-26 to 2016-08-27 – Clinton 48% to Trump 41% https://t.co/J0b3SOT3Rw
- 03:11:05 Clinton vs Trump tipping point change: Clinton by 3.8 in WI -> Clinton by 3.5 in OH https://t.co/Ovyb7XdtbK
- 03:16:13 Poll Added: PPP in PA from 2016-08-26 to 2016-08-27 – Clinton 48% to Trump 43% https://t.co/rd6lLfTeWx
- 03:16:21 Clinton vs Trump state category change: PA has moved from Weak Clinton to Strong Clinton https://t.co/rd6lLfTeWx
- 03:50:40 Clinton vs Kasich tipping point change: Kasich by 0.5 in IA -> Kasich by 0 in VA https://t.co/V1XQToe8FD
- 03:50:41 Clinton vs Kasich expected case changed: Clinton 265 to Kasich 273 -> Clinton 258 to Kasich 280 https://t.co/V1XQToe8FD
- 03:53:23 Those Clinton vs Kasich updates left over from the change in calculation logic from earlier this week. Sorry they were delayed. :-)
- 03:56:41 Trump best case vs Clinton has changed: Clinton 221 to Trump 317 -> Clinton 241 to Trump 297 https://t.co/itBXe6k0hX
- 04:01:43 Sanders vs Trump tipping point change: Sanders by 8.6 in OH -> Sanders by 8.2 in OR https://t.co/6aICr06t5M
- 04:03:36 That Sanders vs Trump one is a left over from the logic change too. :-)
- 04:06:25 Poll Added: PPP in OH from 2016-08-26 to 2016-08-27 – Clinton 46% to Trump 42% https://t.co/ZFz6BXnCtT
- 04:16:11 Clinton vs Trump tipping point change: Clinton by 3.5 in OH -> Clinton by 3.8 in OH https://t.co/mFmhpHLYXk
- 04:23:51 Poll Added: PPP in NC from 2016-08-26 to 2016-08-27 – Clinton 45% to Trump 44% https://t.co/Nr2ZriOsBs
- 04:28:11 Poll Added: PPP in MO from 2016-08-26 to 2016-08-27 – Clinton 41% to Trump 47% https://t.co/M6sqylcIwZ
- 05:03:48 Poll Added: Remington w/4P in KS from 2016-08-22 to 2016-08-23 – Clinton 37% to Trump 44% https://t.co/BsUfWIn4fa
- 05:03:53 Full 4P results logged: Remington w/4P in KS from 2016-08-22 to 2016-08-23 – Clinton 37% to Trump 44% to Johnson 8% to Stein 2%
- 06:19:57 That’s all for today. New data for WI/NY/NC/PA/OH/MI/VA/WV/AZ/NH/MO/KS. Notable changes in OH/MI/NH so @ElectionGraphs blog post later.
- 19:58:34 Retweeted @ElectionGraphs 19:58:21 [Blog Post] Electoral College: Trump Still Rebounding https://t.co/YxTE8C7AuM
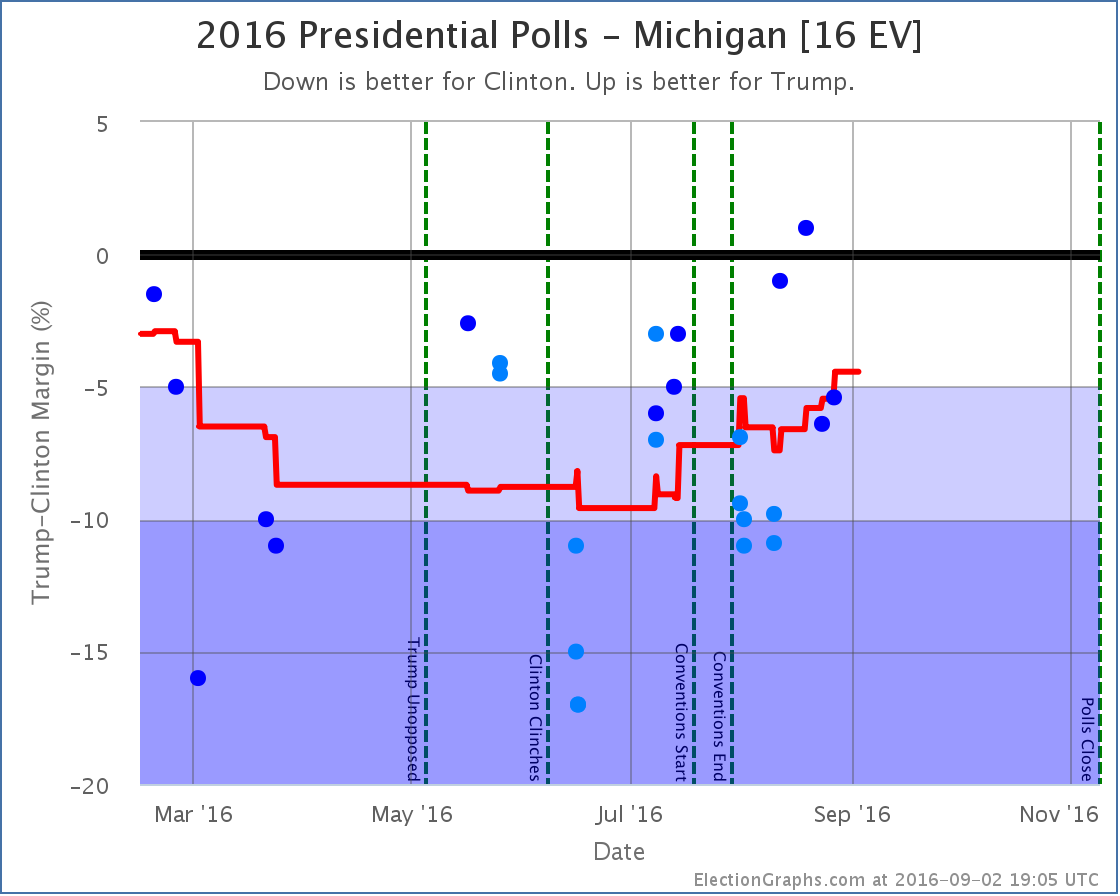
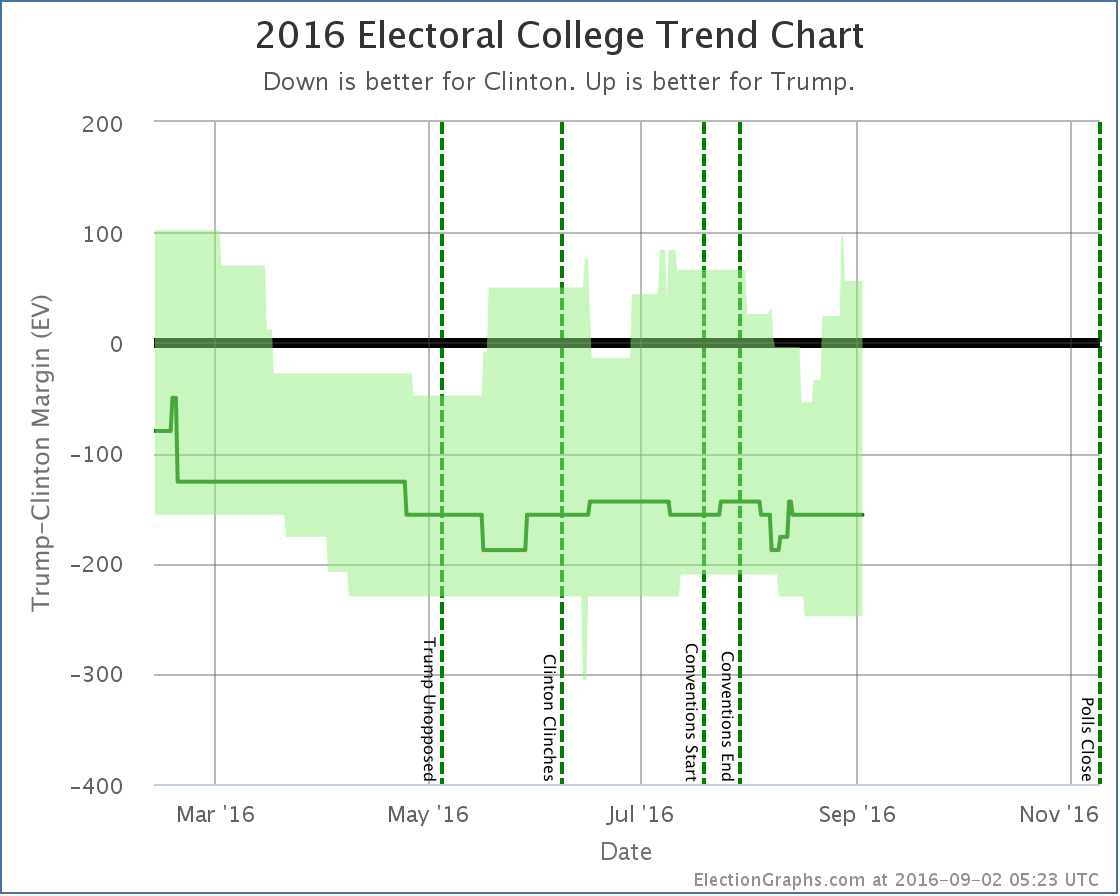
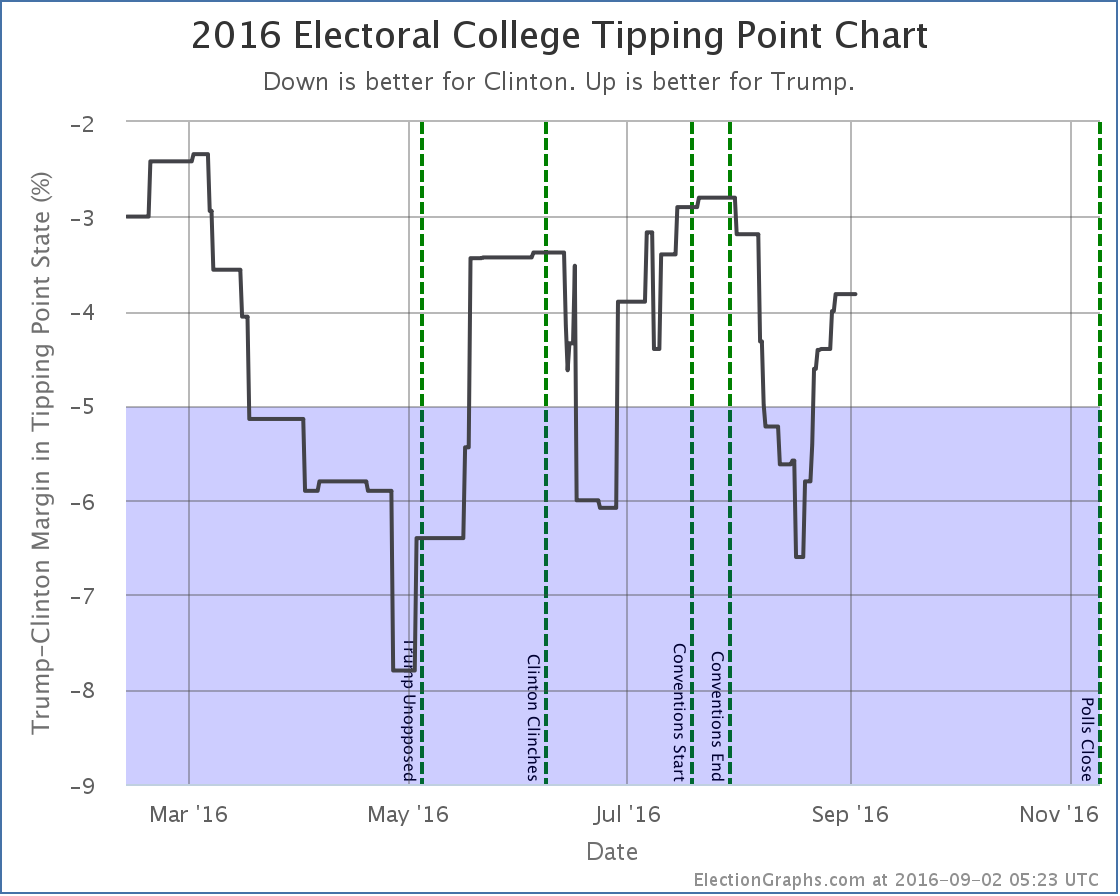
States with new poll data added since the last update: Wisconsin, New York, North Carolina, Pennsylvania, Ohio, Michigan, Virginia, West Virginia, Arizona, New Hampshire, Missouri, Kansas With the logic change out of the way, the race moves on. With the latest batch of polls, one state changes category, and two more contribute to a change in the tipping point. Electoral College Trend Despite a few bad polls for Trump right after the convention, the general trend in Michigan has been a tightening race since the beginning of July. With the latest, Clinton’s lead falls to only 4.4%. For the first time since March, Michigan is looking possible for Trump, so we now include it in his best case. If Trump wins all the states he is ahead in, plus all the states where Clinton leads by less than 5%, he now wins by 56 electoral votes. (Note the transient spike on the chart as well. This was caused by one poll added in this batch briefly bringing Pennsylvania back into reach for Trump, but another poll added in this same batch increased Clinton’s lead again right away, so there was no net change due to Pennsylvania this time.) Tipping Point Ohio and New Hampshire were and still are “Weak Clinton” states, but they wiggled around a bit with the latest polls and moved the tipping point from Clinton by 4.4% in Ohio to Clinton by 3.8% in Ohio, an 0.6% move toward Trump. Overall In both the Trump best case and the tipping point, we see Trump clearly reaching a peak during the conventions, then plummeting the first half of August, then recovering ever since. He isn’t quite back to where he was before the conventions, but he is getting close. So far Trump is making a lot of states that were not close a few weeks ago close. But no states have crossed the center line in the last couple of weeks. We have seen this before. There are a variety of blue states where Trump seems to be able to come close, but he is having a hard time pulling them across the line into the red zone. Since the conventions the “expected” case has been in the range between Clinton winning by 144 and Clinton winning by 188. Trump hasn’t done better than losing by 144 electoral votes since before he was locked up the Republican nomination. The test for any continued Trump rebound will be if he can start to move not just his best case, but the expected case as well. Can he actually flip states? Or just make them close? The electoral college margin in the expected case is deceptive, because these numbers can change very quickly. The tipping point is the thing to watch at the moment. At a 3.8% Clinton margin, less than 1 out of 50 people have to change their minds to flip the outcome. The public is polarized, but 1 out of 50 isn’t all that much in the grand scheme of things. You can imagine events that would flip that many people if Clinton has a bad week. Historically though, Trump is very near his previous ceilings. Every other time he has reached these levels, he has fallen back down fairly quickly. Will this time be different? 67.2 days until the polls start to close. Note: This post is an update based on the data on ElectionGraphs.com. Election Graphs tracks both a poll based estimate of the Electoral College and a numbers based look at the Delegate Races. All of the charts and graphs seen in this post are from that site. Additional graphs, charts and raw data can be found there. Follow @ElectionGraphs on Twitter or like Election Graphs on Facebook to see announcements of updates or to join the conversation. For those interested in individual general election poll updates, follow @ElecCollPolls on Twitter for all the polls as they are added. If you find the information in these posts interesting or useful, please consider visiting the tip jar.
|
||


