This is the website of Abulsme Noibatno Itramne (also known as Sam Minter). Posts here are rare these days. For current stuff, follow me on Mastodon

Categories

Calendar

Popular Vote Margin vs Electoral College Margin

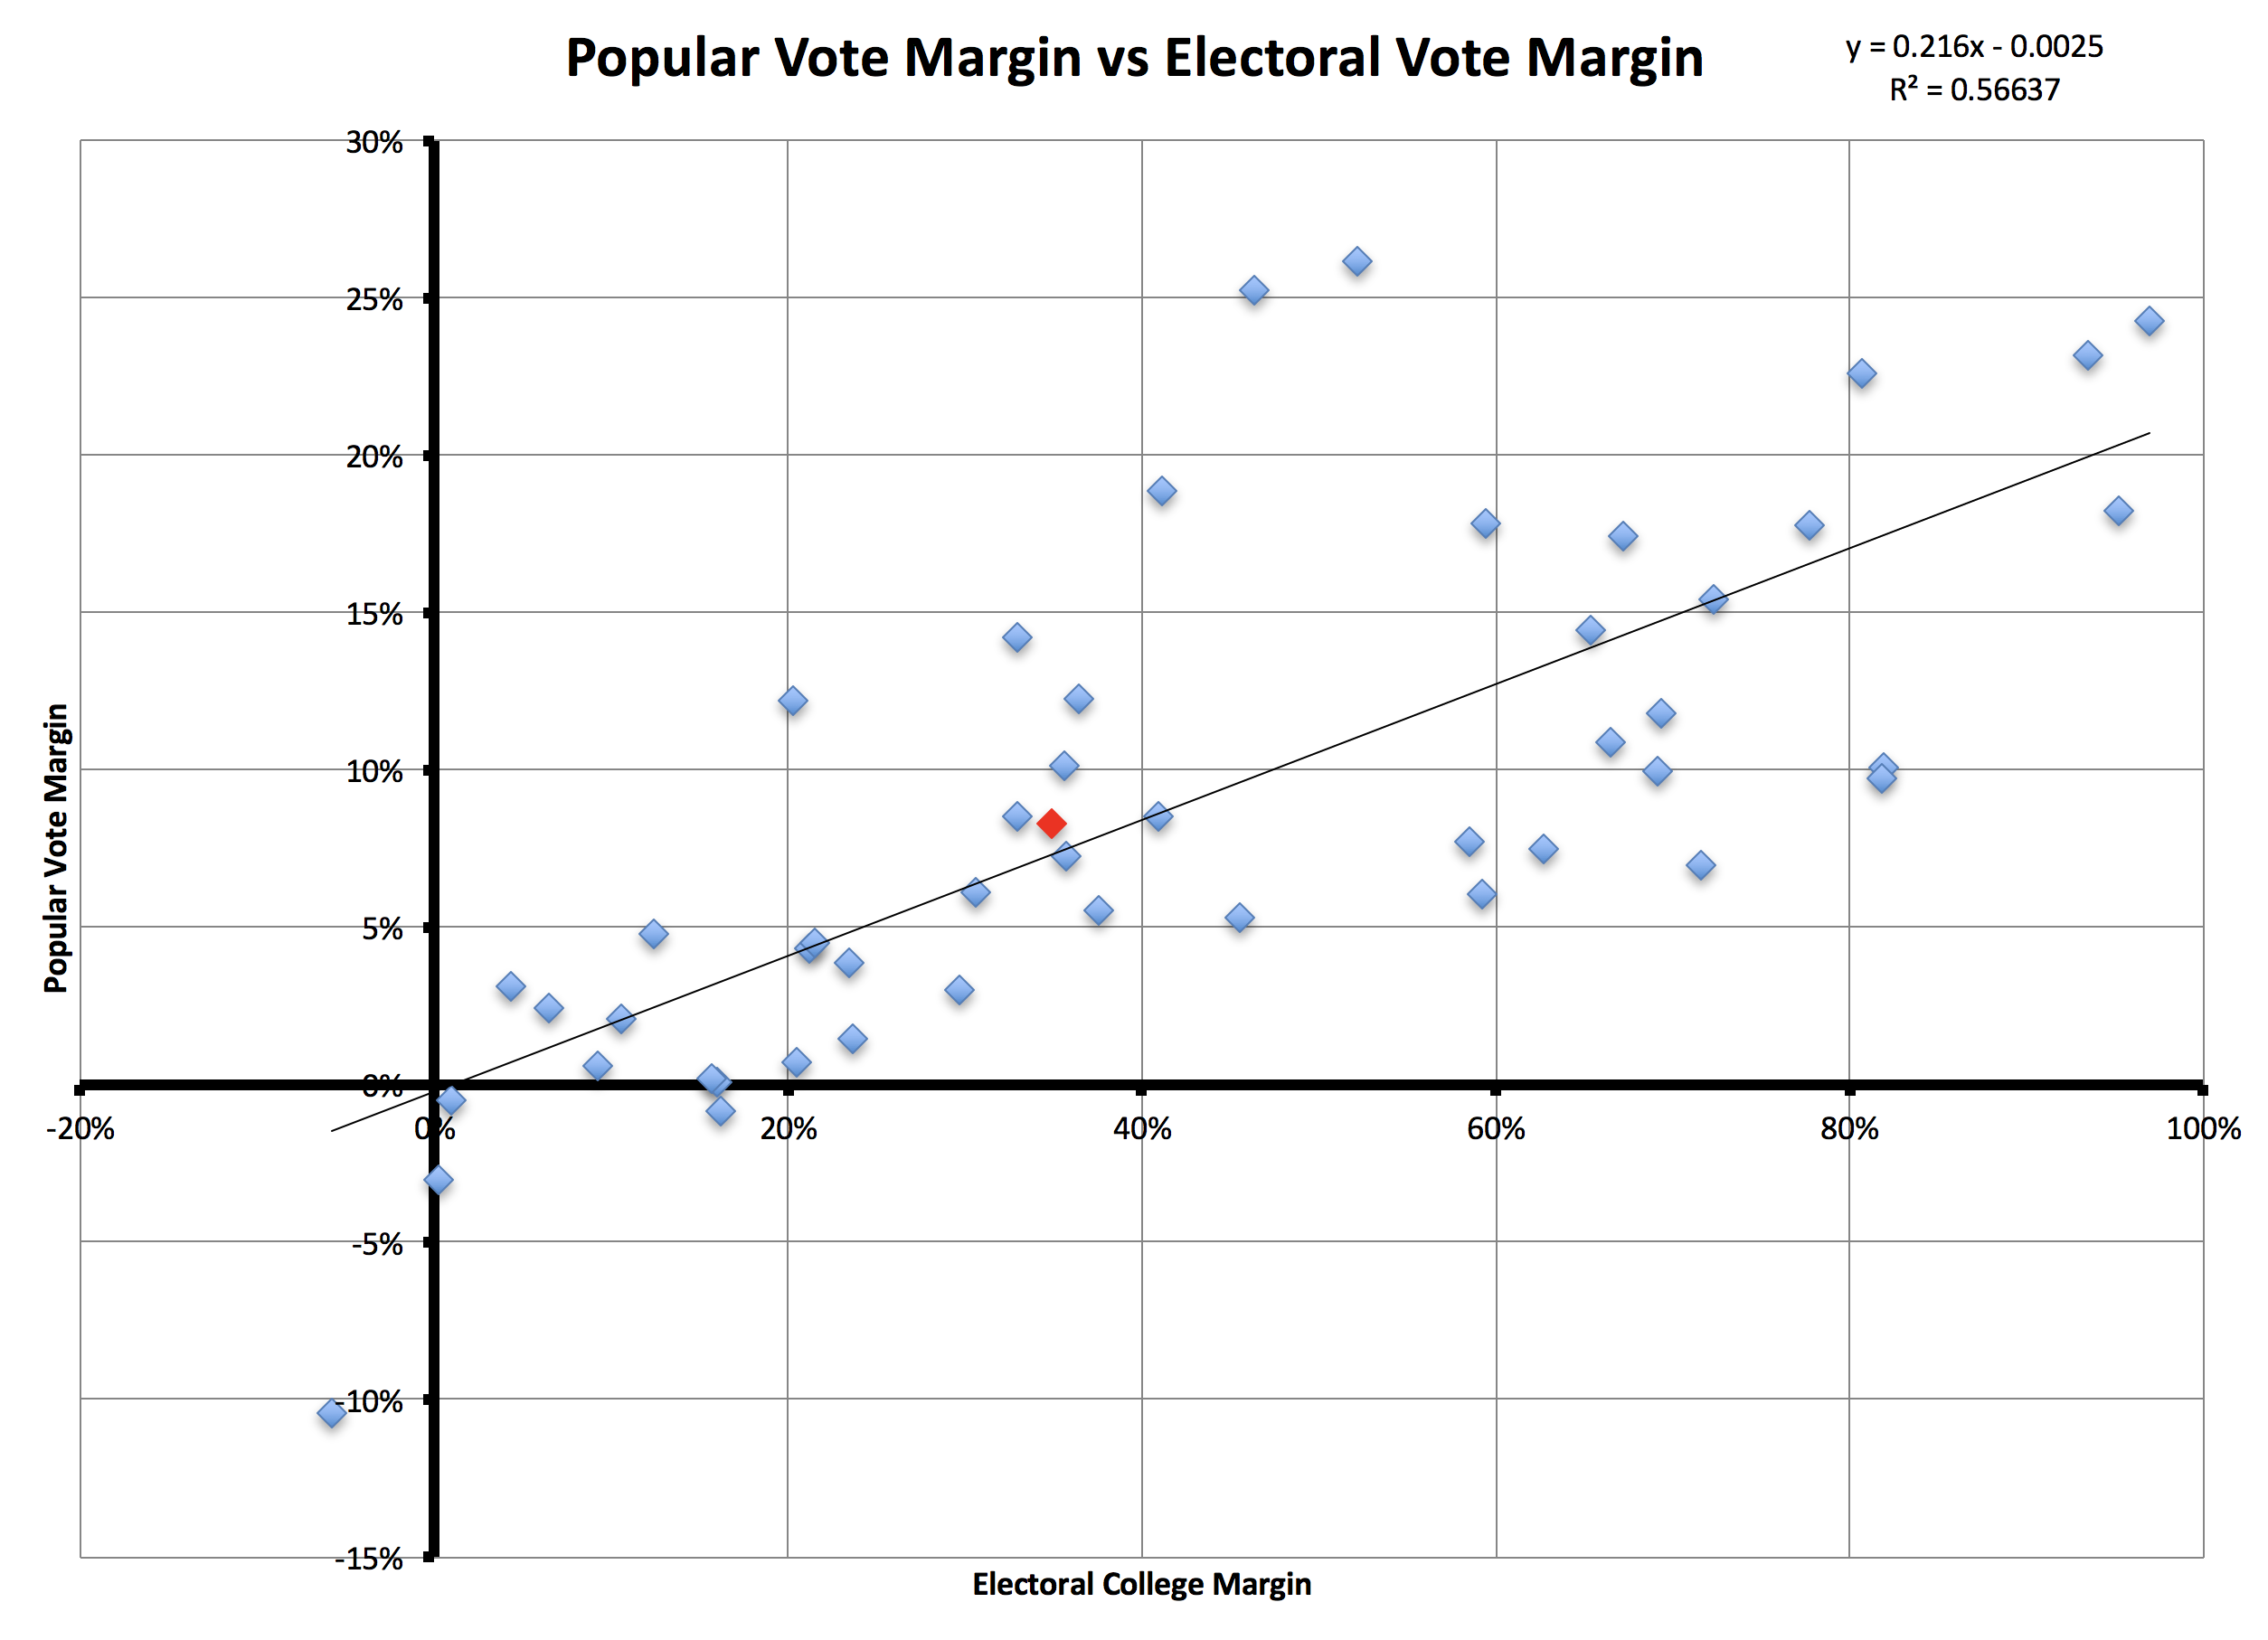
After my post about landslides, Reader Ben asked in the comments about the relationship between the popular vote and electoral vote margins. Since I had all the data handy, here is a chart of that relationship…

Screen Shot 2016-08-16 at 15.31.26544

Each blue point represents one election between 1824 and 2012 with the popular vote margin on the Y axis and the electoral vote margin on the X axis. Interesting to note are the election where the person with the most electoral votes did not win (1824) and the four elections where the popular vote winner did not win (1824, 1876, 1888, 2000).

In general, you can see that there is a correlation between these two ways of measuring the election, but it is actually fairly loose. There is a lot of variance depending on the geographic distribution of support.

More relevant for this year though, the red data point represents the current polls for the 2016 election (as of August 16th), with the popular vote margin represented by the pollster.com average of an 8.3% Clinton lead and the current Election Graphs “expected case” of a 188 electoral vote win (188/538=34.9%) for Clinton.

As I discussed in my previous post, you can see that this election is in the middle of the pack, not an extraordinary “landslide” type win. At least not at the moment. We do still have several months left and things will of course change.

@ElectionGraphs tweets from 2016-08-15 (UTC)

@ElecCollPolls tweets from 2016-08-15 (UTC)

  • 04:42:44 Poll Added: YouGov w/4P in NH from 2016-08-10 to 2016-08-12 – Clinton 45% to Trump 36% https://t.co/nHEOqqpclP
  • 04:42:49 Full 4P results logged: YouGov w/4P in NH from 2016-08-10 to 2016-08-12 – Clinton 45% to Trump 36% to Johnson 5% to Stein 3%
  • 04:48:26 Poll Added: YouGov w/4P in GA from 2016-08-10 to 2016-08-12 – Clinton 41% to Trump 45% https://t.co/5xNiZwpzQh
  • 04:48:32 Full 4P results logged: YouGov w/4P in GA from 2016-08-10 to 2016-08-12 – Clinton 41% to Trump 45% to Johnson 5% to Stein 1%
  • 04:53:43 Poll Added: YouGov w/4P in FL from 2016-08-10 to 2016-08-12 – Clinton 45% to Trump 40% https://t.co/JVQeVYaGzO
  • 04:53:48 Full 4P results logged: YouGov w/4P in FL from 2016-08-10 to 2016-08-12 – Clinton 45% to Trump 40% to Johnson 5% to Stein 2%
  • 05:35:42 Poll Added: Internal Gregg in IN from 2016-08-07 to 2016-08-13 – Clinton 44% to Trump 44% https://t.co/KamDXxKEFY
  • 05:46:54 New data for NH/GA/FL/IN and that is it for today. No changes that prompt a blog post at @ElectionGraphs.

@abulsme tweets from 2016-08-15 (UTC)

@abulsme tweets from 2016-08-14 (UTC)

@ElectionGraphs tweets from 2016-08-13 (UTC)

@ElecCollPolls tweets from 2016-08-13 (UTC)

@abulsme tweets from 2016-08-13 (UTC)

Electoral College: Virginia no longer close, Trump’s position grim

States with new poll data since the last update: Utah, Georgia, Missouri, Kentucky, Illinois, Pennsylvania, North Carolina, Ohio, Iowa, Florida, Kansas, Wisconsin, New Hampshire, Texas, South Carolina, Maine (All), New York, North Carolina, Virginia, Colorado

There have been tons of polls lately, but most of them didn’t cause any change to the analysis here. The exception this time was Virginia:
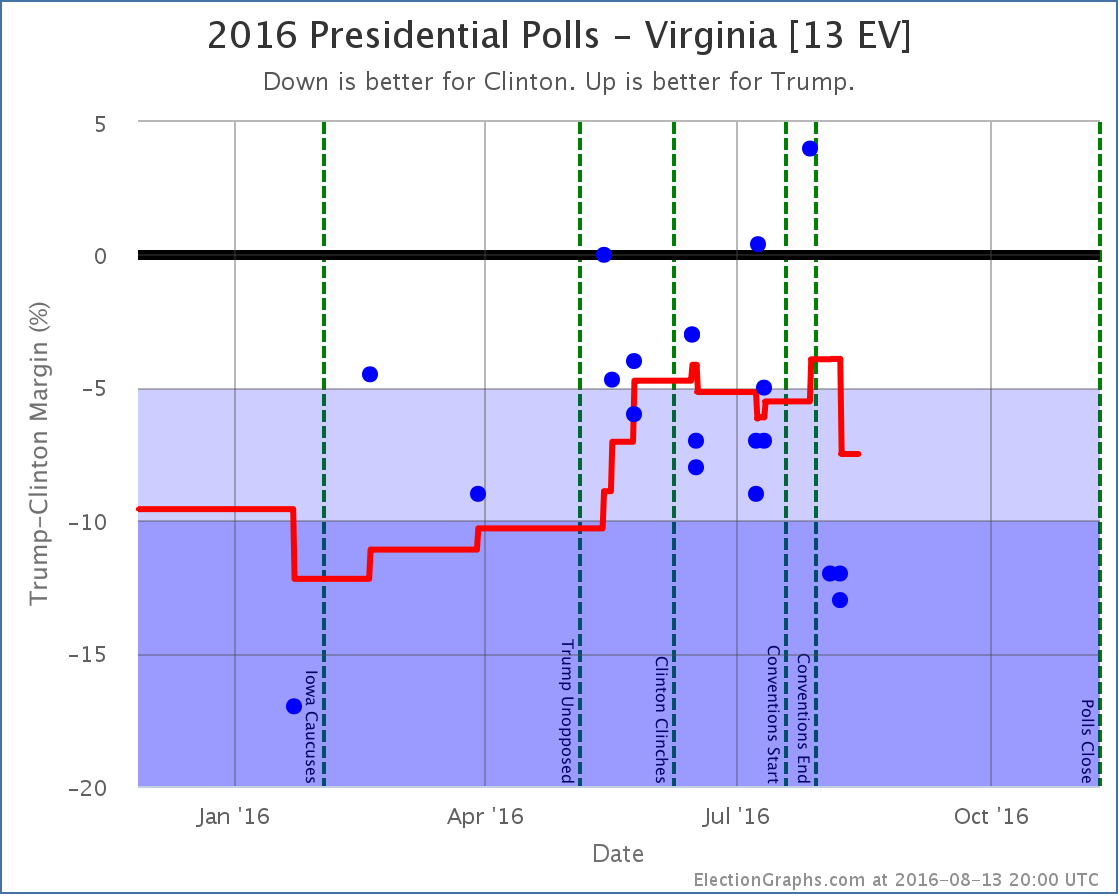
chart-235

Virginia had been hovering at just about the 5% Clinton lead line since May. A poll taken during the convention weeks gave Trump his biggest lead ever in Virginia. This put Virginia on the close state list. Post convention though, both Marist and YouGov polls have shown Clinton with double digit leads. This moves the average from a 3.9% Clinton lead to a 7.5% Clinton lead.

And so Virginia disappears from Trump’s “best case” where we assume he wins not only the states he leads, but also steals all the states where Clinton’s lead is under 5%.
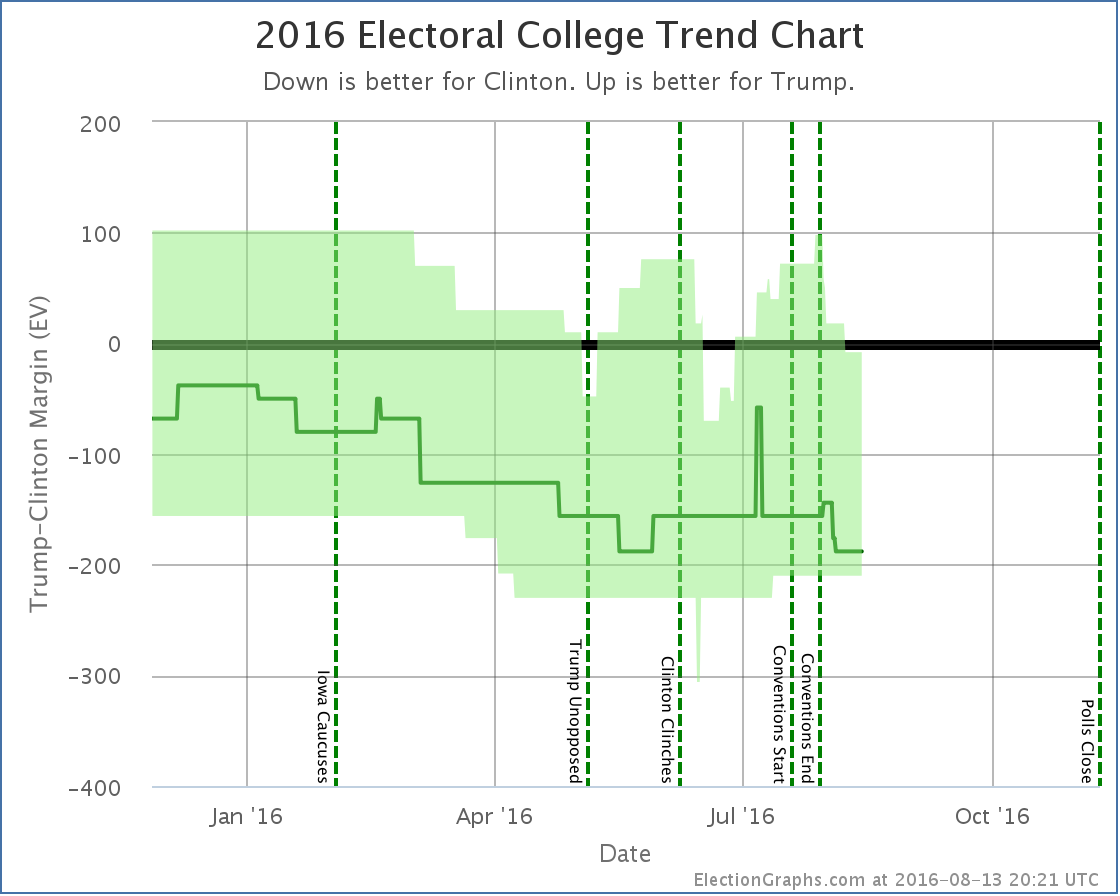
chart-236

Trump’s “best case” is now to lose to Clinton by 8 electoral votes. A narrow loss, but a loss none the less. To win, Trump not only has to pull all the close states to his side, he has to start winning in some states where Clinton has a substantial lead at the moment.

This is even more striking on the chart of the tipping point. Virginia was the tipping point, and when Clinton’s lead there moved, the tipping point also moved dramatically.
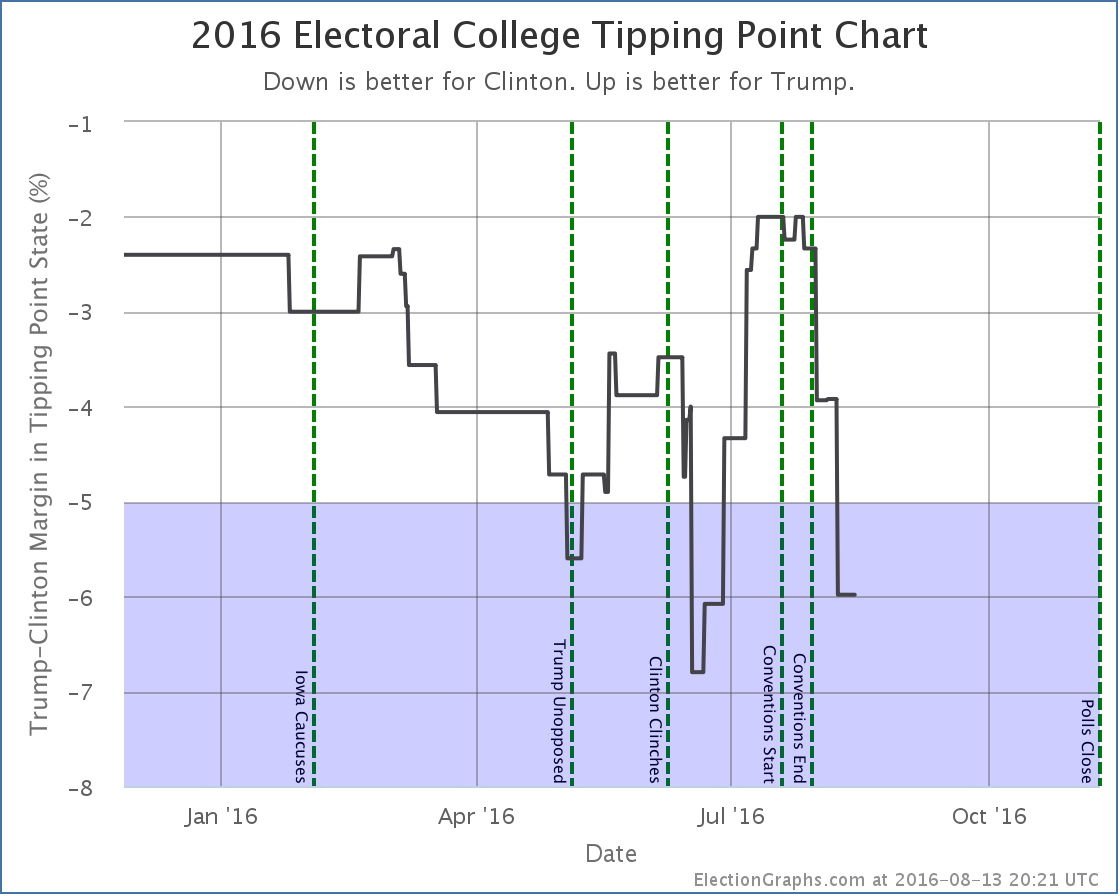
chart-237

The tipping point moves from Clinton +3.9% in Virginia to Clinton +6.0% in Connecticut. Connecticut! We have a situation where it might be CONNECTICUT that puts Clinton over the edge. Not Ohio, not Florida, not any other traditional swing state… but Connecticut. Clinton’s tipping point lead still isn’t as good as it was back in mid-June, but it is getting close.

The center of the spectrum of states now looks like this:
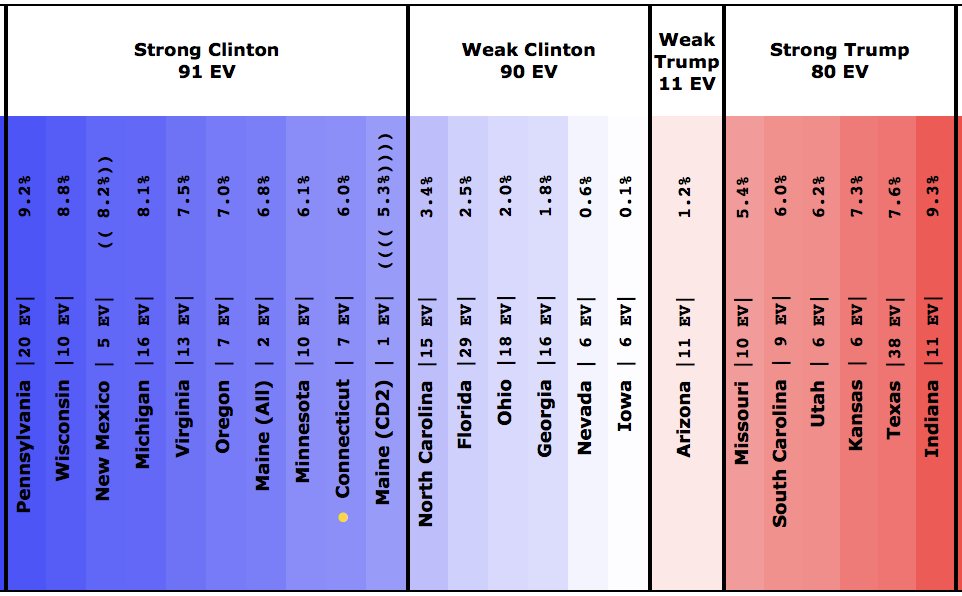
Screen Shot 2016-08-13 at 20.32.37341

And the national summary like this:

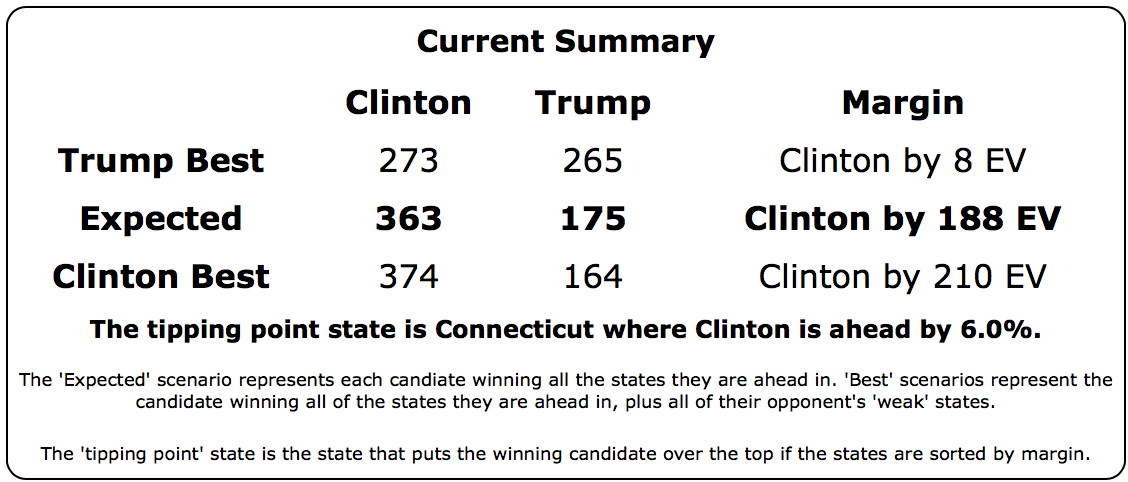
Screen Shot 2016-08-13 at 20.38.30268

This isn’t a Clinton landslide, but it is looking like a very solid Clinton win. Trump needs to reverse his slide to get back in the game. Let alone to win. So far Election Graphs has NEVER shown a Trump win as the expected result, and right now isn’t even showing Trump in serious contention.

But the graphs above do show that things can swing quickly based on what is happening in the campaign and in the world. So we of course all have to keep watching. 87.1 days until polls start to close.

Opinions Wanted! For the data geeks out there, I’ve been having discussions with a few readers about how I handle it when a single pollster releases multiple results. For instance, in the case above, Marist took one poll, but asked about both Clinton vs Trump (Clinton leads by 13%), and Clinton vs Trump vs Johnson vs Stein (Clinton leads by 12%). Currently, in the interest of keeping things as simple as possible, and also of including everything, I just include both of these data points as if they were completely separate. Of course they are not. The same people were asked both questions. They are not independent results, and are usually closely grouped. So I’m in effect double weighting Marist compared to YouGov, who only released one result (Clinton vs Trump vs Johnson in this case). This also makes my normal “five poll average” often include less than five separate pollsters and cover a smaller time period than it would otherwise. Most other sites in these cases pick ONE of the reported results and ignore the others completely. There are other possible ways to handle this as well. I’m considering if I should make changes to how polls are counted on Election Graphs to address this concern, and if so which changes. If you have an opinion, please let me know in the comments or email me directly at abulsme@abulsme.com. Thanks!

Note: This post is an update based on the data on ElectionGraphs.com. Election Graphs tracks both a poll based estimate of the Electoral College and a numbers based look at the Delegate Races. All of the charts and graphs seen in this post are from that site. Additional graphs, charts and raw data can be found there. Follow @ElectionGraphs on Twitter or like Election Graphs on Facebook to see announcements of updates or to join the conversation. For those interested in individual general election poll updates, follow @ElecCollPolls on Twitter for all the polls as they are added. If you find the information in these posts interesting or useful, please consider visiting the tip jar.
Curmudgeon’s Corner: The Stuff That’s Non-Cowed

This week on Curmudgeon’s Corner Sam and Ivan talk about headphones, water, Zika, Delta’s snafu, the Olympics, and… oh yeah, and of course we talk about the Election too. McMullin’s entry into the race, a few Clinton missteps, and then all of the Trump craziness that overshadowed everything else. It is just impossible these days to have a week that isn’t mostly about Trump.

Click below to listen or subscribe… then let us know your own thoughts!

CCCover20151125bw
Recorded 2016-08-10

Length this week – 1:42:14

1-Click Subscribe in iTunes
View Podcast in iTunes
View Raw Podcast Feed
Download MP3 File
Follow the podcast on Facebook

Show Details:

  • (0:00:10-0:09:17) But First
    • Calm Week?
    • Agenda
    • Ivan’s Headphones
    • Movie: Toy Story (1995)
  • (0:10:19-0:28:16) No Election No Trump
    • Ivan’s Water
    • Zika Update
    • Ivan’s Water Again
    • Delta Snafu
    • Olympics
  • (0:29:32-0:54:50) Yes Election No Trump
    • Evan McMullin
    • Clinton Email Again
    • Orlando Shooter’s Father at Clinton rally
    • Republicans endorsing Clinton
  • (0:55:34-1:41:53) Yes Election Yes Trump
    • Intervention
    • Senatorial Endorsements
    • Ad Spending
    • Polling Collapse
    • Alex interlude
    • Economic Plan
    • Iranian Scientist Claim
    • Second Amendment Folks
    • ALeXMXeLA.com
    • Clinton Responses
    • Clinton Ceiling?
    • Trump vs Romney and McCain
    • Feedback

Note: Timestamps are accurate, but many audio players are not very precise on the timestamps they show, especially when scanning forwards and backwards, so depending on your player, if you scan to a specific time, you may not get exactly what is shown above and may have to scan back or forward a bit to get what is expected.


The Curmudgeon’s Corner theme music is generously provided by Ray Lynch.

Our intro is “The Oh of Pleasure” (Amazon MP3 link)

Our outro is “Celestial Soda Pop” (Amazon MP3 link)

Both are from the album “Deep Breakfast” (iTunes link)

Please buy his music!