States with new poll data since the last update: New Hampshire, Georgia, Florida, Indiana, Texas, Virginia, Washington, New York, Michigan, Missouri, Colorado, Iowa, Mississippi
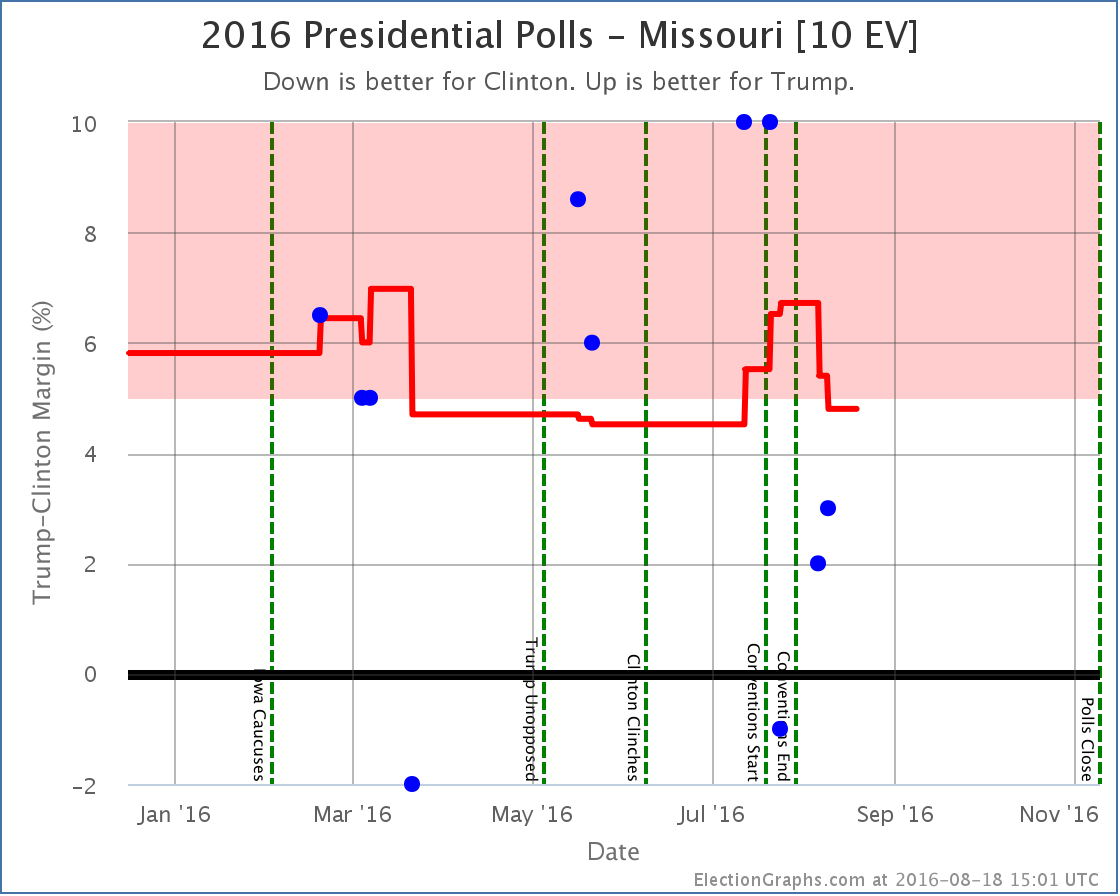
The Trump deterioration continues. This time in the form of weakening in Missouri:

The range in Missouri results is large in the 1.2 months of polling currently used in the average… from Trump up by 10%, to Clinton up by 1%. But the last four polls before the end of the Republican convention all showed Trump up by more than 5%. The three polls taken after the Republican convention ended have all been worse for Trump.
So Trump’s lead in the poll average drops to 4.8%, and Missouri moves from “Strong Trump” to “Weak Trump”. Trump is still ahead, but it is now close enough that we allow the possibility of Clinton winning Missouri in her “best case”.

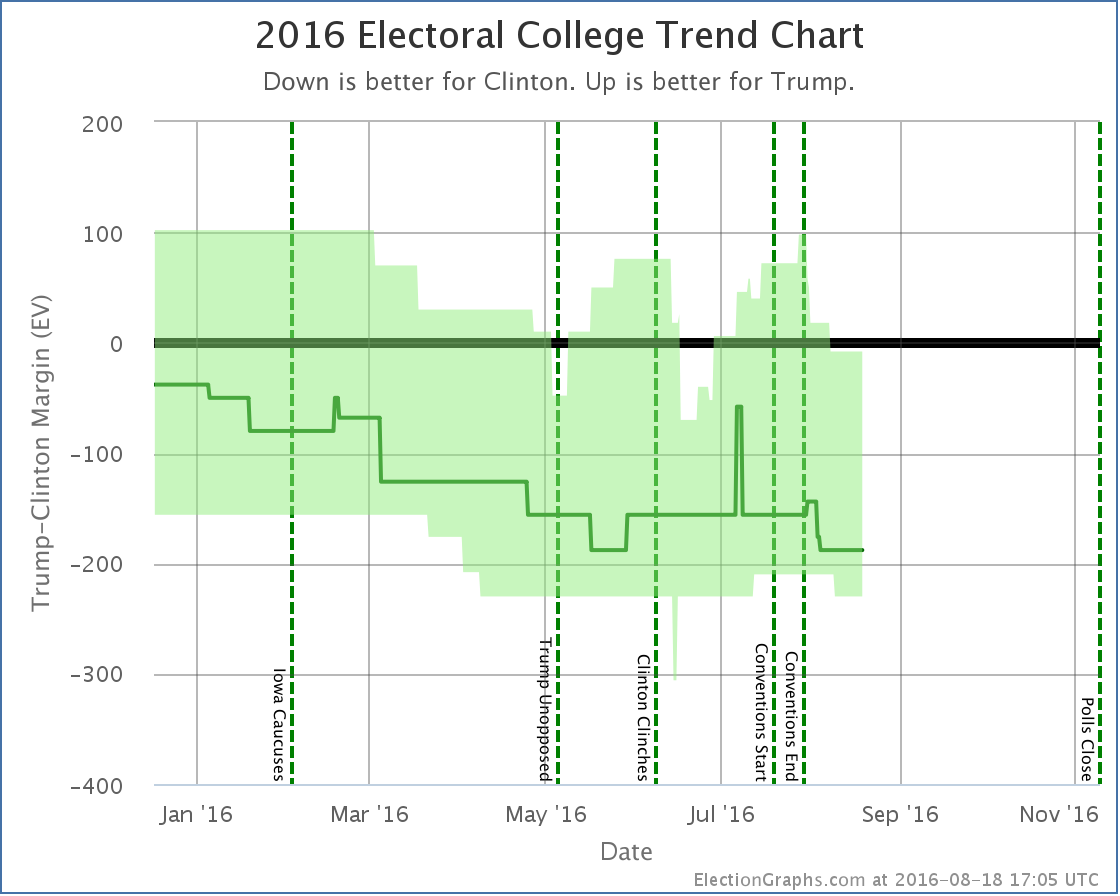
Clinton’s best case is now to win 384 to 154, a 230 electoral vote margin. This is the best number Clinton has seen on this metric aside from a two day period in June where Texas looked close for a moment.
Trump may stop sliding in the polls, or maybe even reverse the trend, but we’re not seeing that yet. For the moment, his collapse continues.
82.3 days until polls start to close on election day.
Note: This post is an update based on the data on ElectionGraphs.com. Election Graphs tracks both a poll based estimate of the Electoral College and a numbers based look at the Delegate Races. All of the charts and graphs seen in this post are from that site. Additional graphs, charts and raw data can be found there. Follow @ElectionGraphs on Twitter or like Election Graphs on Facebook to see announcements of updates or to join the conversation. For those interested in individual general election poll updates, follow @ElecCollPolls on Twitter for all the polls as they are added. If you find the information in these posts interesting or useful, please consider visiting the tip jar.


