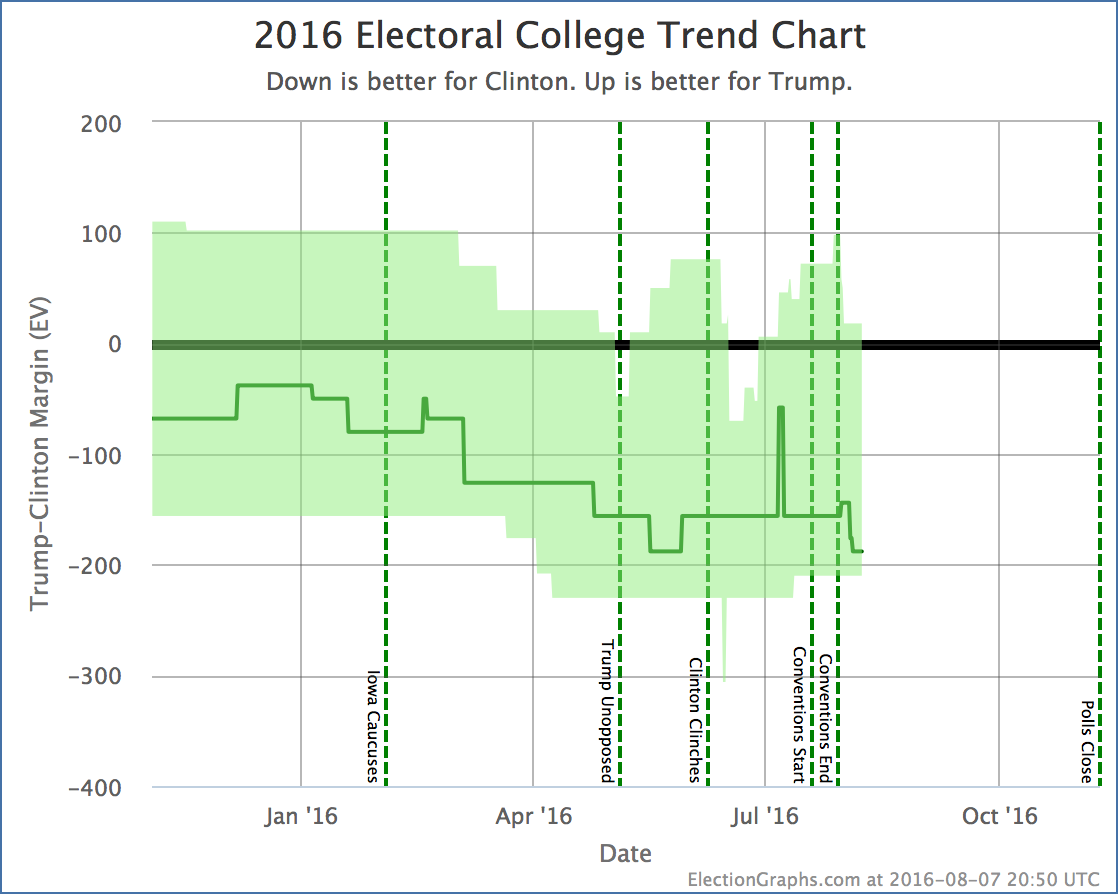
States with new poll data since the last update: Virginia, Nevada, Arizona
The polls keep coming, as they will straight through November. This time there is one change of note, reversing the movement in Nevada from a few days ago.
The polls making up the average still range from Clinton +4.0% to Trump +5.0%. There is wide variance here. The latest poll moves the average to Clinton +0.6%. So just on the Clinton side of the line again. In the end though, the best we can really say is that Nevada could easily go either way given current polling.
For the moment though, Nevada is back on the Clinton side of the center line.
This changes the “expected case” where everybody wins all the states where they lead the polls to Clinton 363 Trump 175, a 188 electoral vote margin for Clinton.
This is Clinton’s best showing in the expected case, tying a brief period in May. The other metrics are not at record levels at the moment, but this is the most important of the metrics tracked here… the actual expected outcome of the election.
The time since the conventions ended has been very good for Clinton. So far. We’ll see how long the trend continues. Clinton may well be near a ceiling here. At this point further gains for Clinton would be involve pulling in states like Arizona, Texas, or Utah. Those states are much closer that was once expected, but they may be very hard to pull in that last little bit.
Of course, even if this is a ceiling for Clinton, the ceiling is at a level where she wins decisively. If we actually see those states going blue, it may be time to start talking about a landslide after all. In the mean time though, if this was a normal campaign, the more realistic expectation would be to see things start drifting back toward Trump from here.
With how things are going though, who knows.
93.1 days until polls start to close on election day.
Note: This post is an update based on the data on ElectionGraphs.com. Election Graphs tracks both a poll based estimate of the Electoral College and a numbers based look at the Delegate Races. All of the charts and graphs seen in this post are from that site. Additional graphs, charts and raw data can be found there. Follow @ElectionGraphs on Twitter or like Election Graphs on Facebook to see announcements of updates or to join the conversation. For those interested in individual general election poll updates, follow @ElecCollPolls on Twitter for all the polls as they are added. If you find the information in these posts interesting or useful, please consider visiting the tip jar.


[Blog Post] Electoral College: Nevada back to Clinton https://t.co/rVK2KNFaAi
RT @ElectionGraphs: [Blog Post] Electoral College: Nevada back to Clinton https://t.co/rVK2KNFaAi
Ivan Bou liked this on Facebook.
RT @ElectionGraphs: [Blog Post] Electoral College: Nevada back to Clinton https://t.co/rVK2KNFaAi
RT @ElectionGraphs: [Blog Post] Electoral College: Nevada back to Clinton https://t.co/rVK2KNFaAi
RT @ElectionGraphs: [Blog Post] Electoral College: Nevada back to Clinton https://t.co/rVK2KNFaAi
I’ve been fascinated, since May, watching the number of “weak” trump states shrinking so there’s now only one. While I’d expect some hardening of views, I’m curious if this is atypical and what might be the cause. I understand we’re likely in a bubble towards Clinton, but why didn’t more of Trump’s strong states become weak?
Hi Ben. The short answer is they might have, but we just don’t know yet. Most of the polling is concentrated on the “traditional battlegrounds”. Polling on the “Strong Trump” states is fairly sparse. For instance: In Missouri there has only been one post-convention poll so far. It does show the race close, but the five poll average stretches back to May. In Texas, there haven’t been any polls at all since June and the five poll average goes back to February. Utah had one poll during the conventions, but the average stretches back to June. The next state in my spectrum is South Carolina. No polls since May and to get five polls you need to go all the way back to September 2015. Contrast to the “Weak” states for both candidates and you’ll see most have had recent polls, and the poll average usually covers about a month, sometimes less. Where there is more polling, we can see changes more quickly. Meanwhile if there had been any change in South Carolina, we’d have no idea, because nobody has polled it in months. You kind of expect that with the changes in national polls, these states would move too. But frankly, if states like Texas and South Carolina end up in play, you’re no longer looking at determining who wins, you are looking at how big the Clinton landslide is going to be, which is a more academic question I guess, so there is less interest in polling those states.