States with new poll data since the last update: Pennsylvania, California, Oregon, Delaware, Vermont, Indiana
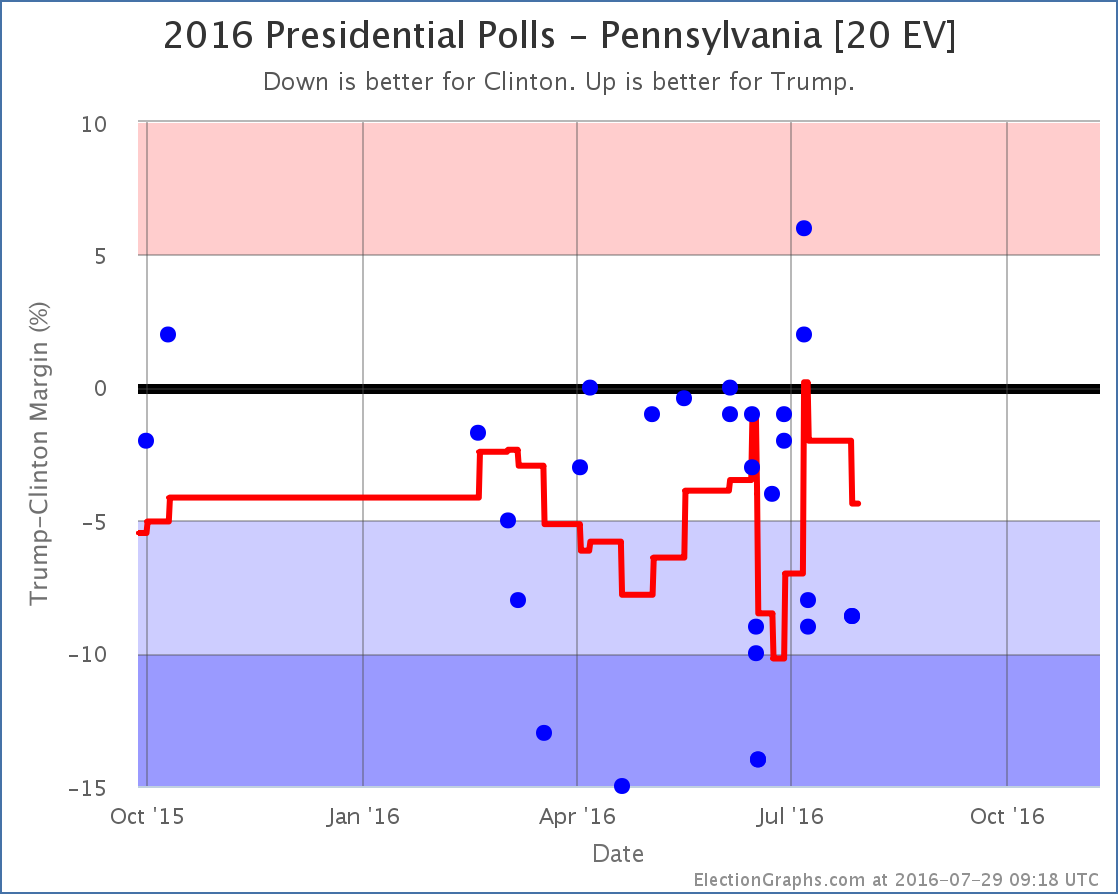
Results from a Suffolk poll in Pennsylvania taken during the first three days of the Democratic National Convention move that state’s average toward Clinton.
The average moves from a 2.0% lead to a 4.4% lead. This is not an insubstantial jump toward Clinton, but either way we classify the state as “Weak Clinton”. Pennsylvania was the tipping point state though, so the tipping point moves too…
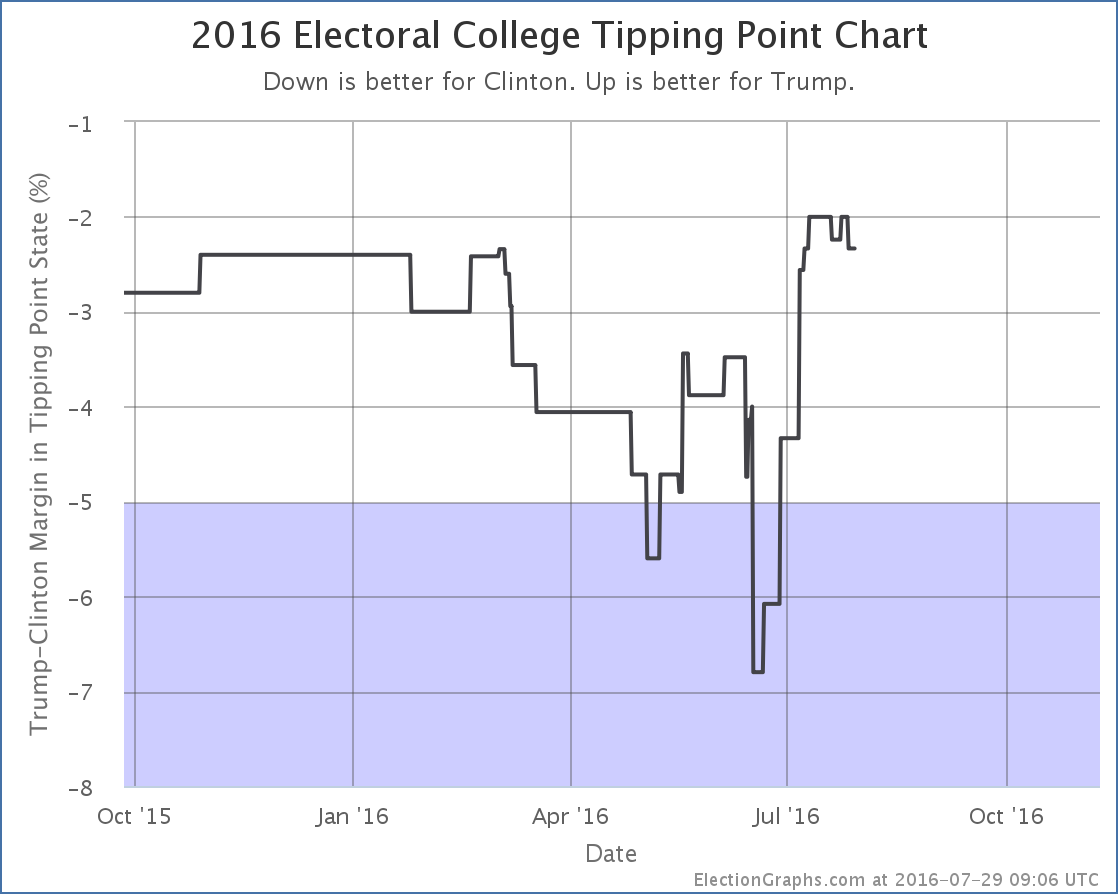
The tipping point moves from Clinton in Pennsylvania by 2.0% to Clinton in North Carolina by 2.3%.
This is a pretty small change in the grand scheme of things. Compare to the huge move of the tipping point in Trump’s direction from mid-June to mid-July.
Is the new jag downward the start of a new larger move back toward Clinton? Too soon to say. Stay tuned.
102.6 days until polls start to close…
Note: This post is an update based on the data on ElectionGraphs.com. Election Graphs tracks both a poll based estimate of the Electoral College and a numbers based look at the Delegate Races. All of the charts and graphs seen in this post are from that site. Additional graphs, charts and raw data can be found there. Follow @ElectionGraphs on Twitter or like Election Graphs on Facebook to see announcements of updates or to join the conversation. For those interested in individual general election poll updates, follow @ElecCollPolls on Twitter for all the polls as they are added. If you find the information in these posts interesting or useful, please consider visiting the tip jar.


[Blog Post] Electoral College: Tipping point slips back toward Clinton https://t.co/rn7rU8jcsD
RT @ElectionGraphs: [Blog Post] Electoral College: Tipping point slips back toward Clinton https://t.co/rn7rU8jcsD