States with new poll data since the last update: Virginia, Ohio, Iowa, Michigan, Connecticut, Illinois, Idaho, New York.
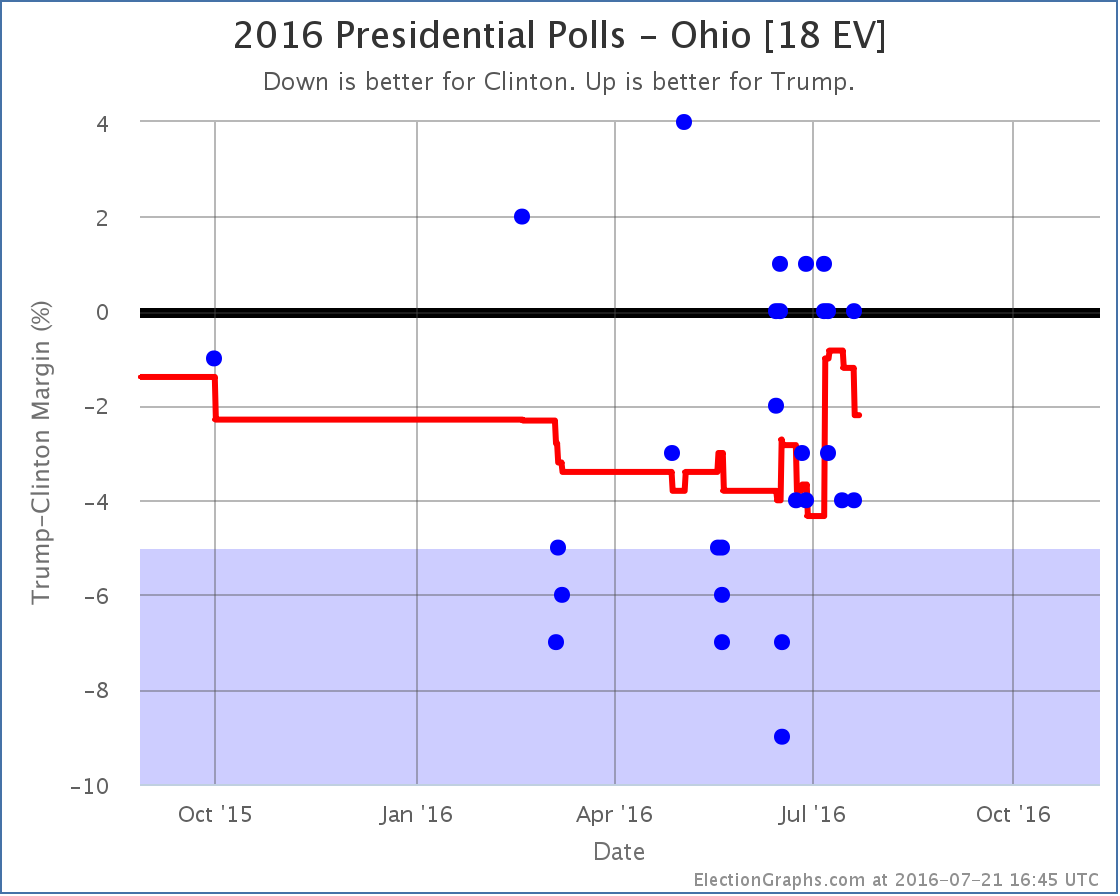
We have the first state poll that includes data after the start of the Republican National Convention, covering Monday through Wednesday of the convention week. It is for Ohio, and it moves the poll average… toward Clinton.
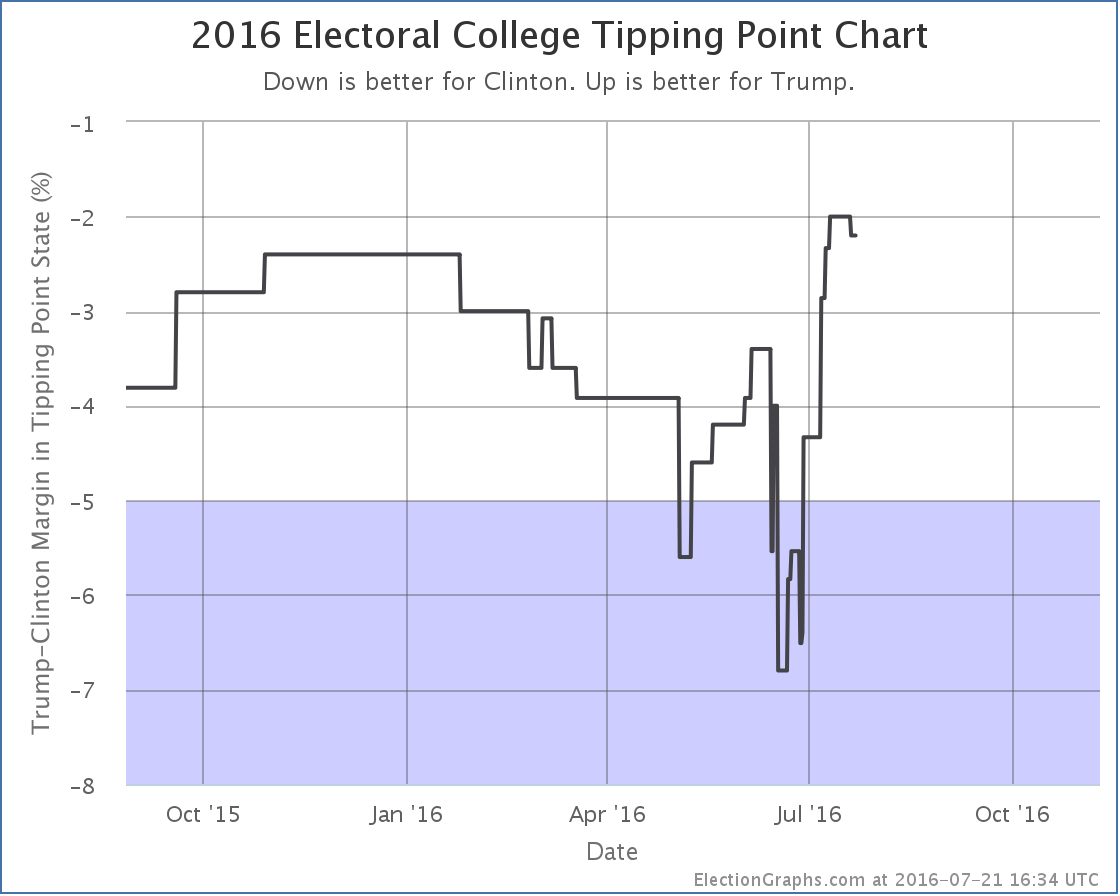
This move does not change the status of Ohio. It was Weak Clinton before and it Weak Clinton now. But it does change the tipping point, which also moves toward Clinton.
The tipping point moved from a 2.0% Clinton lead in Pennsylvania to a 2.2% Clinton lead in Ohio.
So, aren’t we supposed to be seeing a convention bump for Trump? What’s up with a move toward Clinton during Trump’s convention?
The widespread view at this point is that the Republican Convention has been undisciplined and off message. It is tempting to look at this and start thinking about an “anti-bump” due to a botched convention.
That is premature. One poll in one state moved the average in that state a little, which because that state was near the tipping point also moved that a little bit… by 0.2%. There is not enough here to call a trend. If we saw a number of additional moves in this direction then maybe… but right now, it is just a single small move in isolation.
With the two conventions back to back, it is unlikely we will be able to detect a clear bump pattern for the two conventions individually. Instead, once both conventions are over, and there have been a week or two of post-convention polls, we’ll be able to get a sense if there has been a noticeable impact from the conventions.
In the mean time, we will of course keep watching for any trends that do emerge.
110.0 days until polls start to close on election night…
Note: This post is an update based on the data on ElectionGraphs.com. Election Graphs tracks both a poll based estimate of the Electoral College and a numbers based look at the Delegate Races. All of the charts and graphs seen in this post are from that site. Additional graphs, charts and raw data can be found there. Follow @ElectionGraphs on Twitter or like Election Graphs on Facebook to see announcements of updates or to join the conversation. For those interested in individual general election poll updates, follow @ElecCollPolls on Twitter for all the polls as they are added. If you find the information in these posts interesting or useful, please consider visiting the tip jar.

