Polls added since last update: Ohio, Pennsylvania, California, Arizona, Florida, Michigan, North Carolina, New Hampshire, Nevada, Wisconsin, Oregon, Vermont, Alaska, Colorado, Idaho, Iowa, Maine (All), Missouri, Oklahoma, Texas, Utah.
In addition to a number of actual new polls, I recently got a helpful batch of data from Darryl, another election modeler who posts at horsesass.org. His latest update is here. His analysis uses state polling averages, but then runs a Monte Carlo simulation to generate a distribution of possible outcomes and win odds, rather than simply the electoral result range based on the close states going one way or another like I do here. Good stuff, you should check it out.
In any case, Darryl sent me a batch of polls he had in his database that I had apparently missed. Most of these were older polls and though they jiggled the lines in the past a bit, did not change the current analysis. Except in one state: Colorado.
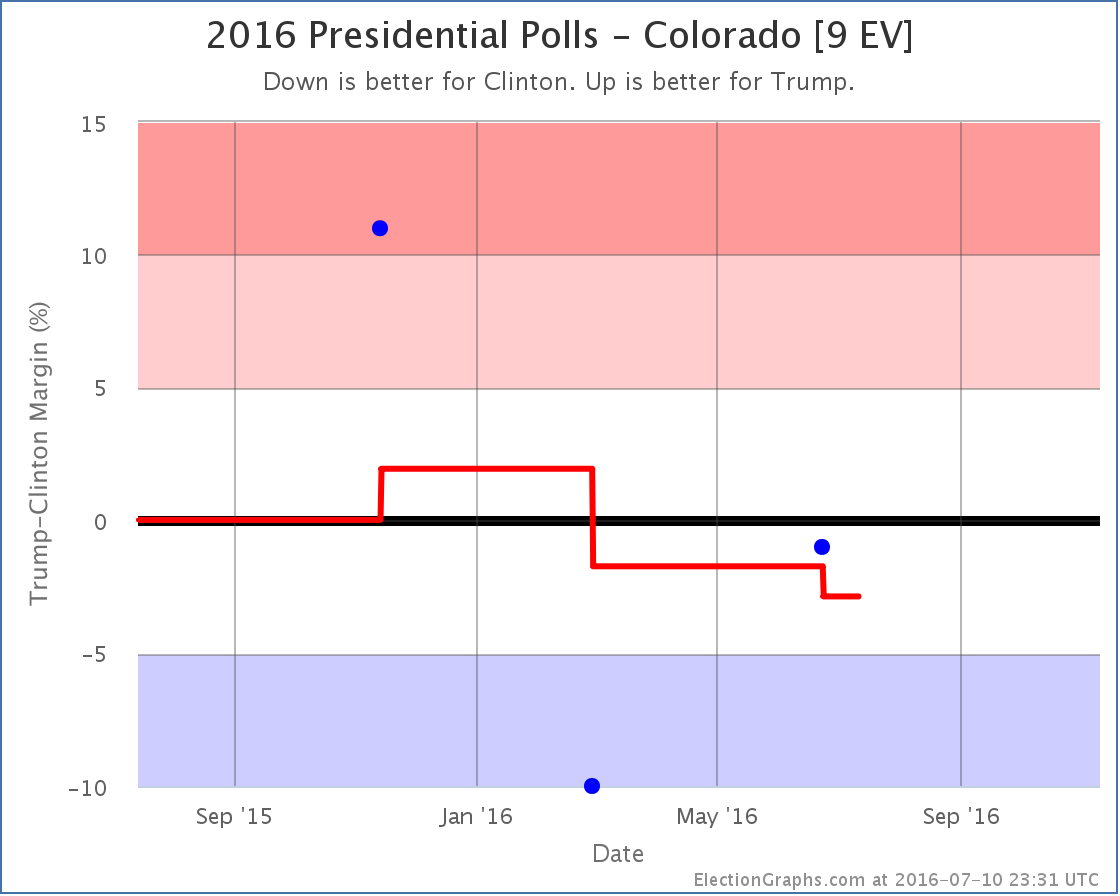
Colorado has been very lightly polled given how it is one of the states that has actually gone both ways in the last five elections. The poll Darryl had found which I had missed was a Keating poll back in February, that showed Clinton with a significant lead. With only three Clinton vs Trump polls total so far, and old elections filling out the polling average, that one poll makes a difference.
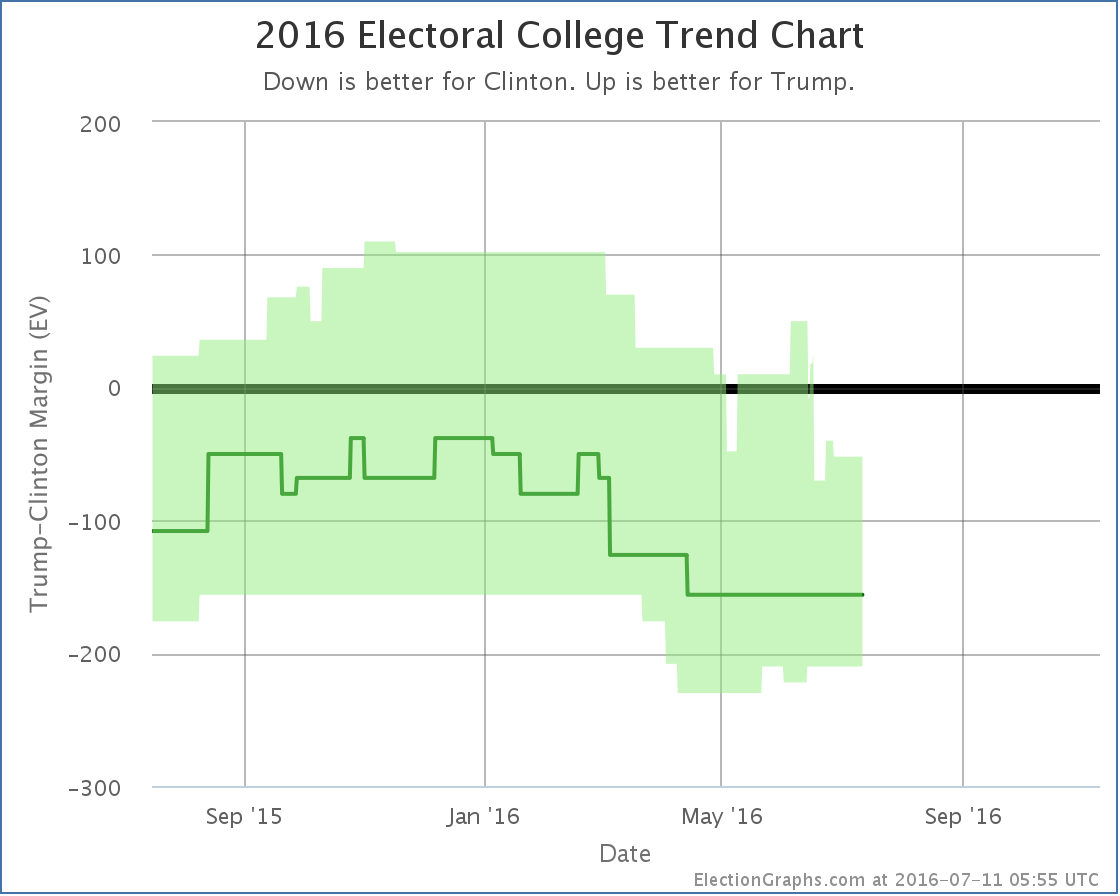
With that poll now in place, the average moves from “Weak Trump” to “Weak Clinton”. In fact, since it was an older poll that was responsible for the change, Colorado has actually been “Weak Clinton” for months now, we just didn’t know it. This change is now reflected in all the graphs.
Everything on the center “expected result” line since late February moves down 18 as Colorado’s 9 electoral votes flip from red to blue. Colorado still looks close though. Clinton’s lead is only 2.9% and the three polls we do have range from Clinton up 10%, to Trump up 11%. We still don’t have a really great picture of Colorado. More polls are needed there.
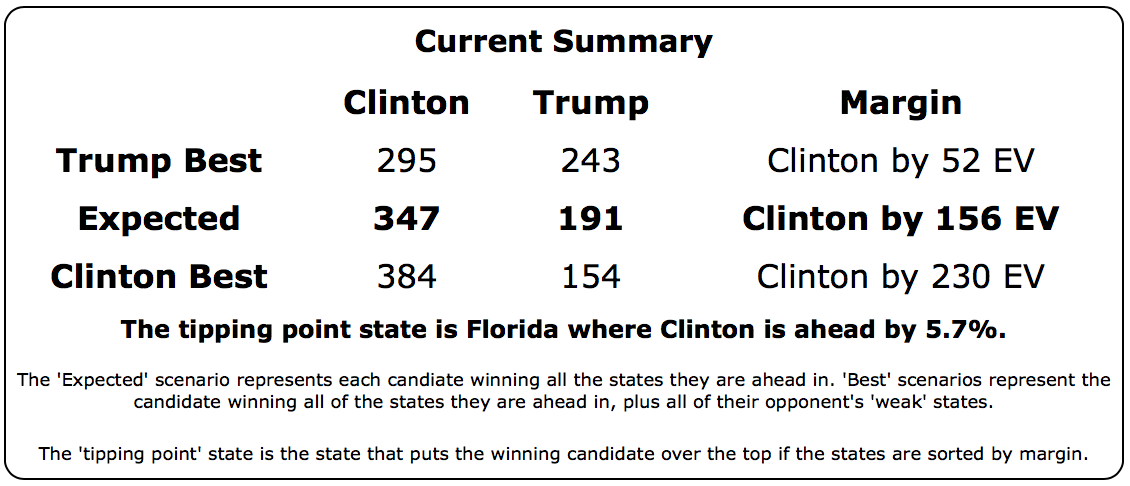
In the mean time, the new national summary looks like this:

We still have a picture of Clinton dominating Trump. Even if Trump wins all the close states, he still loses. In the expected case, Trump’s result is still better than McCain but worse than Romney. A loss to be sure, but a loss comparable to the Republican losses in the last two elections, not an unusually bad loss.
We are now only a week away from the Republican convention. There is usually a bit of a bounce after a convention (although it usually doesn’t last too long). But this year is unusual. Who knows what we will see.
120.3 days until polls start to close on Election 2016.
Note: This post is an update based on the data on ElectionGraphs.com. Election Graphs tracks both a poll based estimate of the Electoral College and a numbers based look at the Delegate Races. All of the charts and graphs seen in this post are from that site. Additional graphs, charts and raw data can be found there. Follow @ElectionGraphs on Twitter or like Election Graphs on Facebook to see announcements of updates or to join the conversation. For those interested in individual general election poll updates, follow @ElecCollPolls on Twitter for all the polls as they are added. If you find the information in these posts interesting or useful, please consider visiting the tip jar.


[Blog Post] Electoral College: Colorado into the Blue https://t.co/4P5pNdBQ2I
RT @ElectionGraphs: [Blog Post] Electoral College: Colorado into the Blue https://t.co/4P5pNdBQ2I