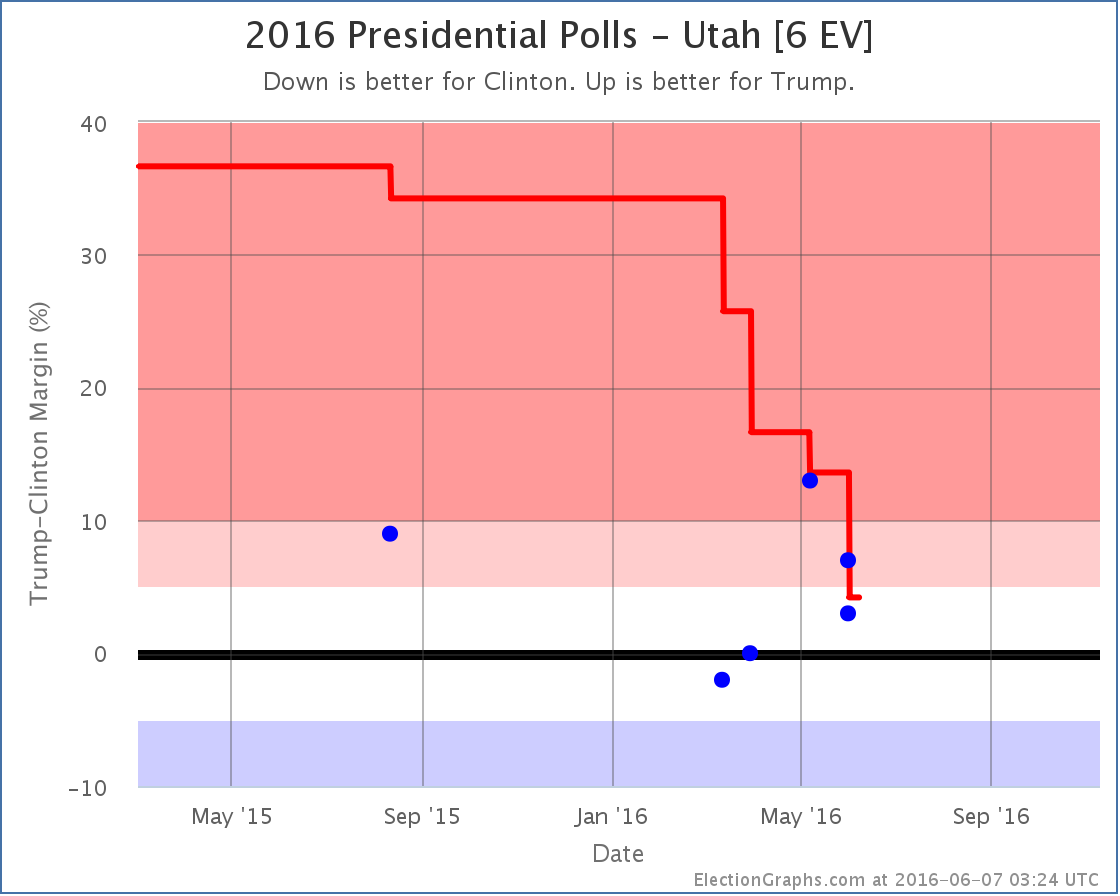
Since the last update there have been polls in New Jersey, California and Utah. The results in Utah are the ones that made a difference:
There are actually two new results logged in Utah, both from Gravis, covering the same time period. They asked the general election question twice. Once with just Clinton and Trump showing Trump leading by 7%, then again adding Johnson as a possibility, which reduces Trump’s lead to 3%. Rather than pick one or the other result, I include both.
It could be argued that this gives a single poll double weight in the average, but the way I think of it, this really is two separate results, measuring the election in different ways. So I chose to include both. This is arguable, and other people tracking poll averages may choose a different route. But this is the way I am doing it.*
In any case, these polls are within the range we have seen in all the polls this year. There is quite a bit of variability, but the one thing that is clear is that the Republican lead is much smaller than the 21% to 48% margins the Republicans saw in the 1996 to 2012 general elections. Since my poll averages are “primed” with the results of those five elections, it took awhile for the poll average to move from the huge Republican margin one would expect if Utah followed the pattern of the last few elections down to the 4.2% margin Trump now has. Put simply, this change was so large, a lot of evidence was needed before the average really believed it.
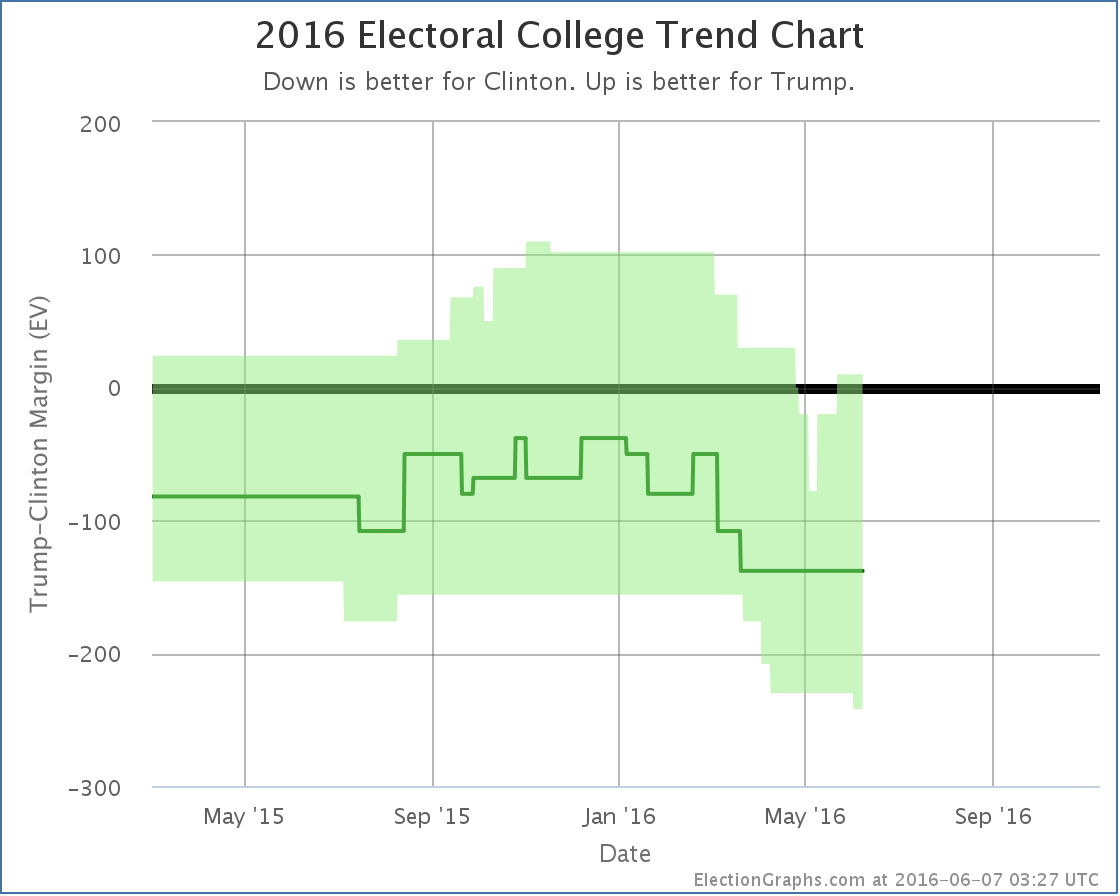
With Trump’s lead in Utah now less than 5%, it now goes into the Election Graphs “Weak Trump” category, which means it is a possible Clinton pick up. So her best case scenario improves:
That little nub at the bottom right represents the possibility of Clinton winning Utah.
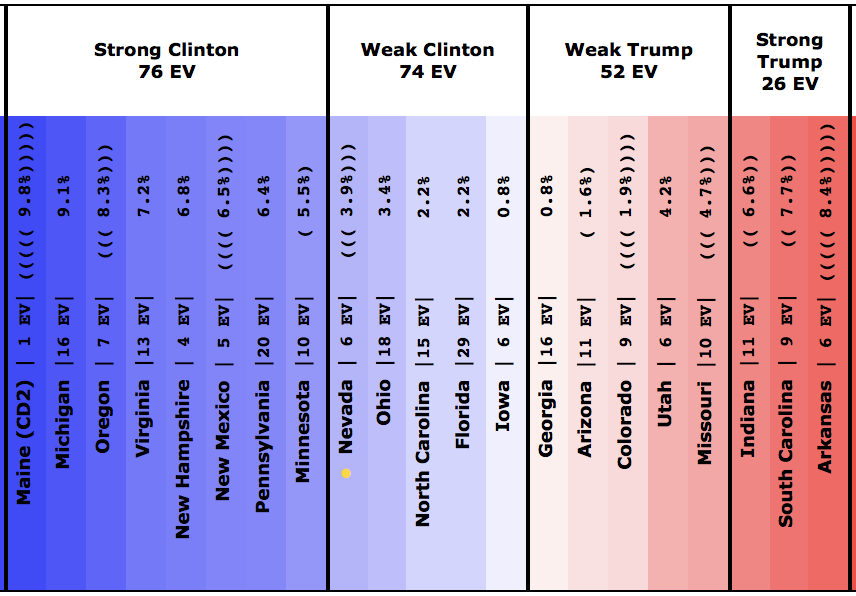
Leaving out the states where one of the candidates is ahead by more than 10%, the center of the spectrum now looks like this:
There are a lot of states here that haven’t yet had a full five polls for our average (indicated by the parentheses). But the fact that Georgia, Arizona and Utah may be competitive for Clinton show that Trump may indeed be “redrawing the map”… just not in his favor.
The tipping point is only a 3.9% Clinton lead on the other hand, so it isn’t an insurmountable lead by any means. Trump could still win this if campaign events go his way.
But Utah a possible Democratic stretch goal? Wow. Utah!
For reference, the last time Utah went Democratic was the Lyndon Johnson landslide over Barry Goldwater in 1964. Now, I still wouldn’t bet on Clinton winning Utah. But that it is even close is still stunning.
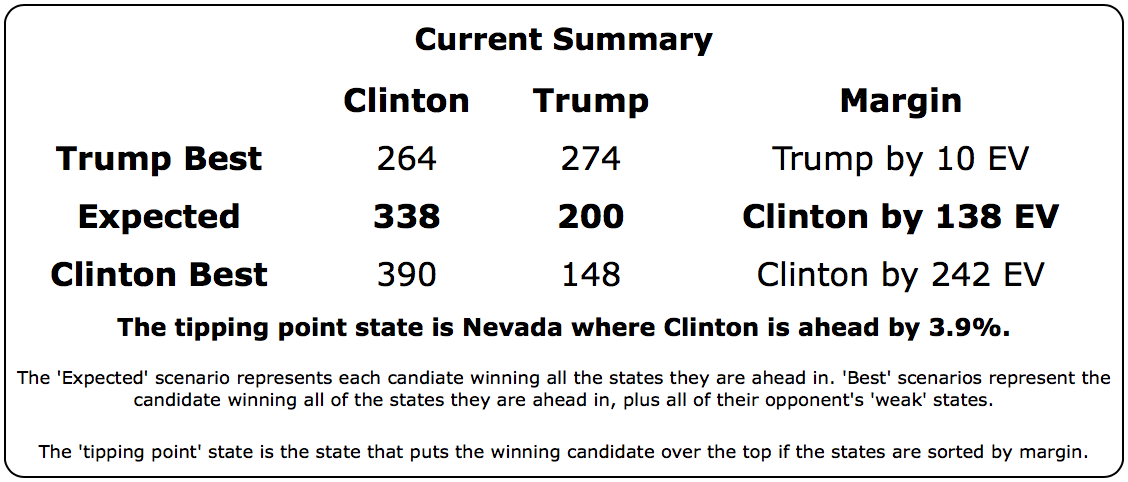
The overall situation summary now looks like this:
So wait, is the Trump bounce over? Well, this is a move in Clinton’s direction, so it breaks the streak of movements in Trump’s direction that had lasted for about a month. So by that measure at least the “bump” may be over.
This is just one change though, it would be premature to say that the trend is now in Clinton’s direction. As usual, we need to wait for more polls…
154.8 days until the general election polls start to close. There will be plenty of movement between now and then. Stay tuned.
* For more notes on how polls including third and forth parties will be treated on Election Graphs, see the archive of @ElecCollPolls tweets from May 29th.
Note: This post is an update based on the data on ElectionGraphs.com. Election Graphs tracks both a poll based estimate of the Electoral College and a numbers based look at the Delegate Races. All of the charts and graphs seen in this post are from that site. Additional graphs, charts and raw data can be found there. Follow @ElectionGraphs on Twitter or like Election Graphs on Facebook to see announcements of updates or to join the conversation. For those interested in individual general election poll updates, follow @ElecCollPolls on Twitter for all the polls as they are added. If you find the information in these posts interesting or useful, please consider visiting the tip jar.
Edit 14:20 UTC – Fixed typo.


