- 13:31:12 Poll Added: Suffolk in MA from 2016-05-02 to 2016-05-05 – Clinton 54.80% to Trump 31.40% https://t.co/CnMGIqj9ct
- 13:36:20 Poll Added: Quinnipiac in FL from 2016-04-27 to 2016-05-08 – Clinton 43% to Trump 42% https://t.co/Q64ZScYFlZ
- 13:36:25 Clinton vs Trump state category change: FL has moved from Weak Clinton to Strong Clinton https://t.co/Q64ZScYFlZ
- 13:39:47 Poll Added: Quinnipiac in OH from 2016-04-27 to 2016-05-08 – Clinton 39% to Trump 43% https://t.co/GoUfN5DXbA
- 13:42:15 Clinton vs Trump tipping point change: Clinton by 5.2 in NC -> Clinton by 5.6 in FL https://t.co/Nvz1mG18fY
- 13:42:17 Trump best case vs Clinton has changed: Clinton 279 to Trump 259 -> Clinton 308 to Trump 230 https://t.co/Nvz1mG18fY
- 13:43:44 Poll Added: Quinnipiac in PA from 2016-04-27 to 2016-05-08 – Clinton 43% to Trump 42% https://t.co/XjpUiQdvrs
- 13:46:55 Poll Added: Quinnipiac in FL from 2016-04-27 to 2016-05-08 – Sanders 44% to Trump 42% https://t.co/a9kkvOHb9e
- 13:49:46 Poll Added: Quinnipiac in OH from 2016-04-27 to 2016-05-08 – Sanders 43% to Trump 41% https://t.co/eS16t5vCr9
- 13:52:36 Poll Added: Quinnipiac in PA from 2016-04-27 to 2016-05-08 – Sanders 47% to Trump 41% https://t.co/RTJUqLPQ18
- 13:56:42 Sanders vs Trump tipping point change: Sanders by 8.2 in PA -> Sanders by 8.2 in OR https://t.co/1H5womWpx4
- 14:01:27 Poll Added: Dartmouth in NH from 2016-04-11 to 2016-04-15 – Clinton 34.3% to Cruz 32.6% https://t.co/qXBd9ERQOC
- 14:04:12 Poll Added: Dartmouth in NH from 2016-04-11 to 2016-04-15 – Clinton 33.7% to Trump 29.4% https://t.co/9KDIwJHMb3
- 14:07:23 Poll Added: Dartmouth in NH from 2016-04-11 to 2016-04-15 – Clinton 25.7% to Kasich 52.7% https://t.co/xokLtg03Z1
- 14:07:28 Clinton vs Kasich state category change: NH has moved from Strong Kasich to Solid Kasich https://t.co/xokLtg03Z1
- 14:10:01 Poll Added: Dartmouth in NH from 2016-04-11 to 2016-04-15 – Sanders 49.0% to Trump 28.4% https://t.co/3B8kyxgUXm
- 14:13:37 Poll Added: Dartmouth in NH from 2016-04-11 to 2016-04-15 – Sanders 48.4% to Cruz 25.6% https://t.co/1OOZKTPGbN
- 14:16:44 Poll Added: Dartmouth in NH from 2016-04-11 to 2016-04-15 – Sanders 39.3% to Kasich 43.6% https://t.co/Uvz1RparuK
- 14:16:49 Sanders vs Kasich state category change: NH has moved from Solid Sanders to Strong Sanders https://t.co/Uvz1RparuK
- 14:19:54 Poll Added: Dartmouth in NH from 2016-04-11 to 2016-04-15 – Clinton 32.3% to Ryan 38.5% https://t.co/g8tDI1vBBT
- 14:26:29 Poll Added: Dartmouth in NH from 2016-04-11 to 2016-04-15 – Sanders 44.4% to Ryan 32.2% https://t.co/4R2K6JJs06
- 14:44:19 Polls in MA/FL/OH/PA/NH & that is it for today’s update. There was a significant state status change, so blog post at @ElectionGraphs later.
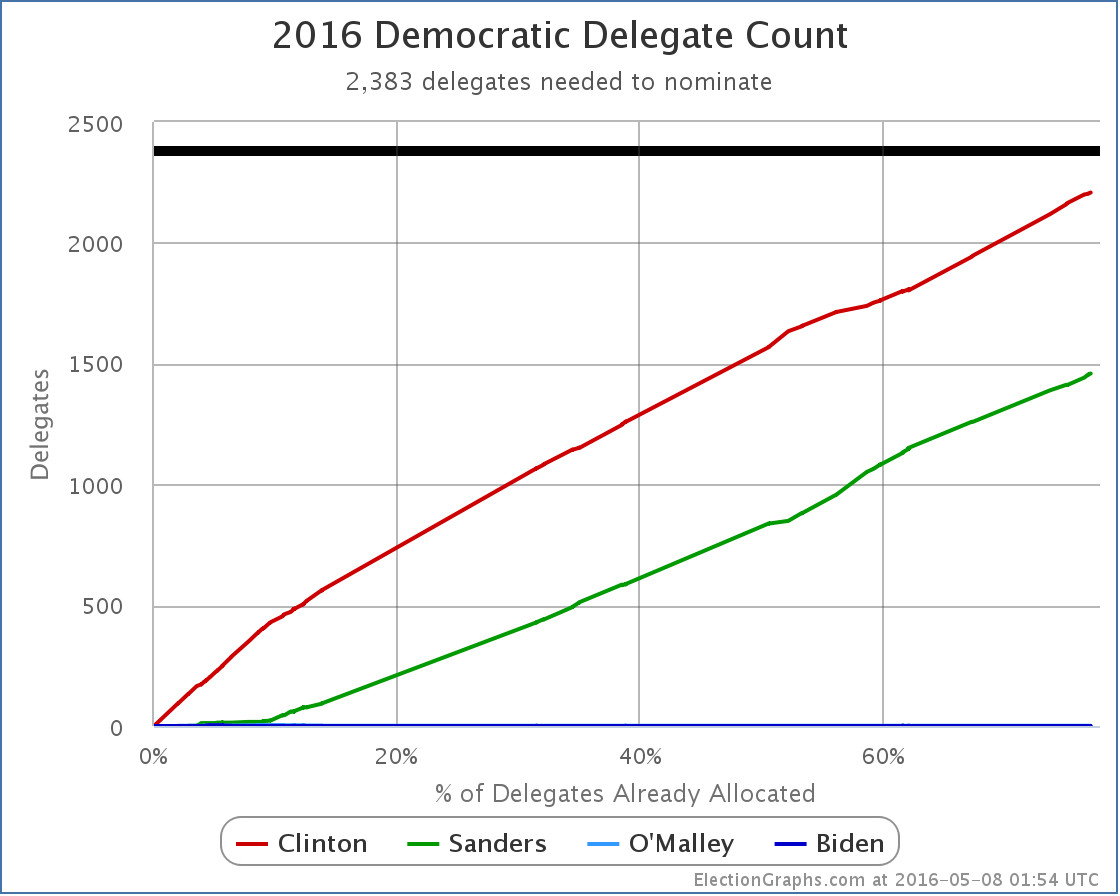
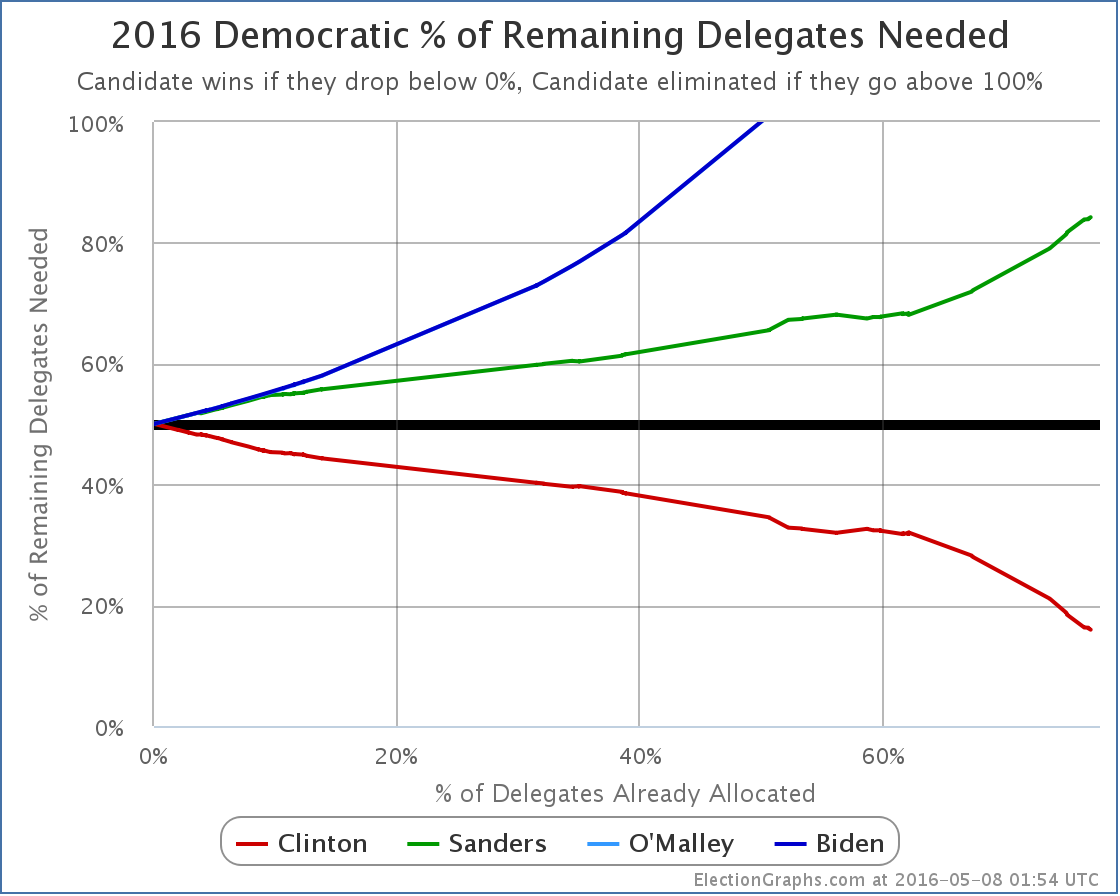
Clinton won Guam. She got 4 delegates. Sanders got 3. This is of course a tiny number of delegates and changes nothing. In addition, since Indiana, 3 more superdelegates were added to Clinton’s total, and one pledged delegate in Mississippi moved from Clinton to Sanders due to updates there. So the net change since Indiana is Clinton +6, Sanders +4. This difference is barely visible in the charts, but here are the updated charts anyway: New overall totals: Clinton 2208, Sanders 1459, O’Malley 1. You’d think at some point that O’Malley superdelegate would say they support someone else. But not yet. Clinton now only needs 15.95% of the remaining delegates to clinch the nomination. Sanders would need 84.23% of the remaining delegates to catch up and win. And so we continue to watch the Clinton win play out. Update 2016-05-11 05:26 UTC: Superdelegate update – Clinton +2. Update 2016-05-11 05:33 UTC: Update from Maine – Sanders +1, Clinton -1. Note: This post is an update based on the data on ElectionGraphs.com. Election Graphs tracks both a poll based estimate of the Electoral College and a numbers based look at the Delegate Races. All of the charts and graphs seen in this post are from that site. Additional graphs, charts and raw data can be found there. All charts above are clickable to go to the current version of the detail page the chart is from, which may contain more up to date information than the snapshots on this page, which were current as of the time of this post. Follow @ElectionGraphs on Twitter or like Election Graphs on Facebook to see announcements of updates or to join the conversation. For those interested in individual general election poll updates, follow @ElecCollPolls on Twitter for all the polls as they are added.
|
||

