Since the last post here on the Electoral College back on April 19th there have been new polls in Maryland, Wisconsin, North Carolina (x3), Pennsylvania, New Hampshire, Indiana, and Arizona. Today the latest in Arizona and North Carolina make a difference to the ElectionGraphs.com estimates. There are two state category changes for Clinton vs Trump and one for Clinton vs Cruz. All three of these changes favor Clinton.
Clinton vs Trump
Maybe everything is going Trump’s way in the primary campaign right now, but things are heading in the opposite direction for the general election.
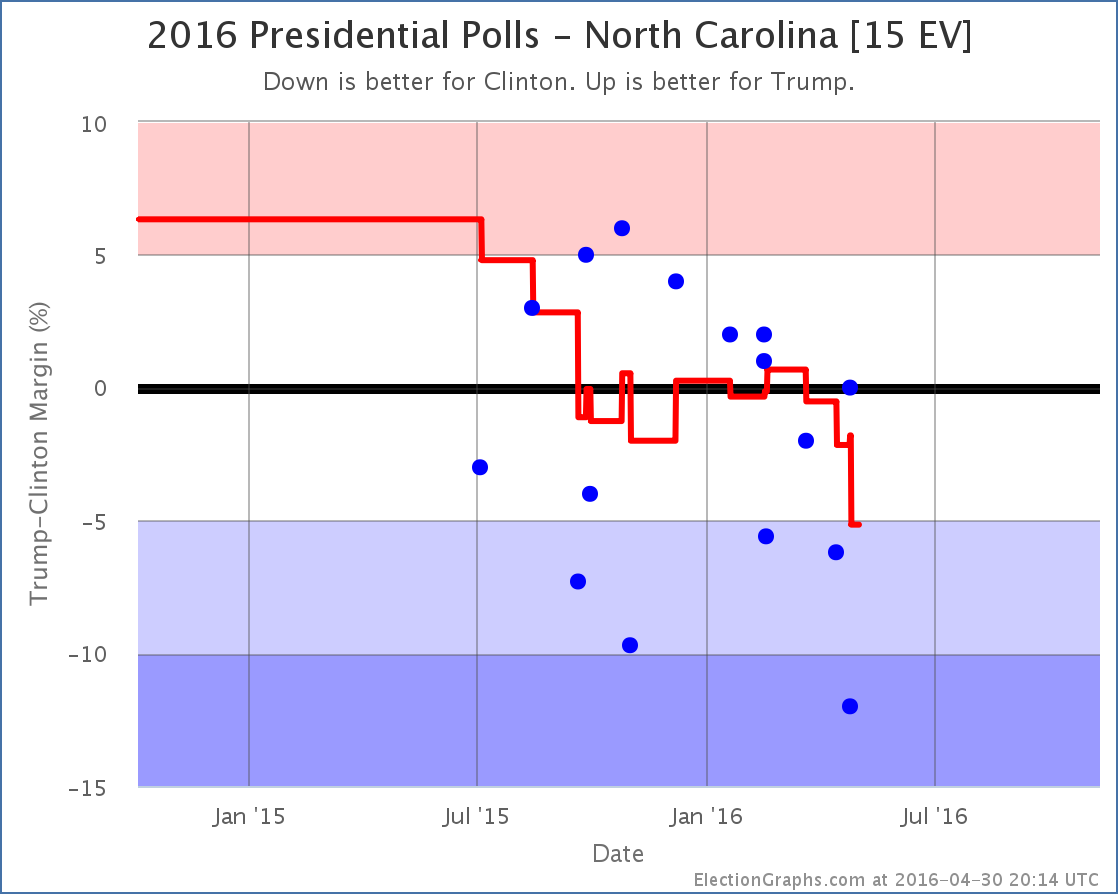
For quite a few months, the Clinton vs Trump poll average in North Carolina just bounced back and forth between Clinton and Trump. But as of now, the best Trump has done in the five most recent polls is a tie. The average has been trending downward since mid-March. The average is now a 5.2% Clinton lead. With that, North Carolina moves from “Weak Clinton” to “Strong Clinton”. This makes North Carolina blue enough that it isn’t considered a possible Trump pick up in the model any more.
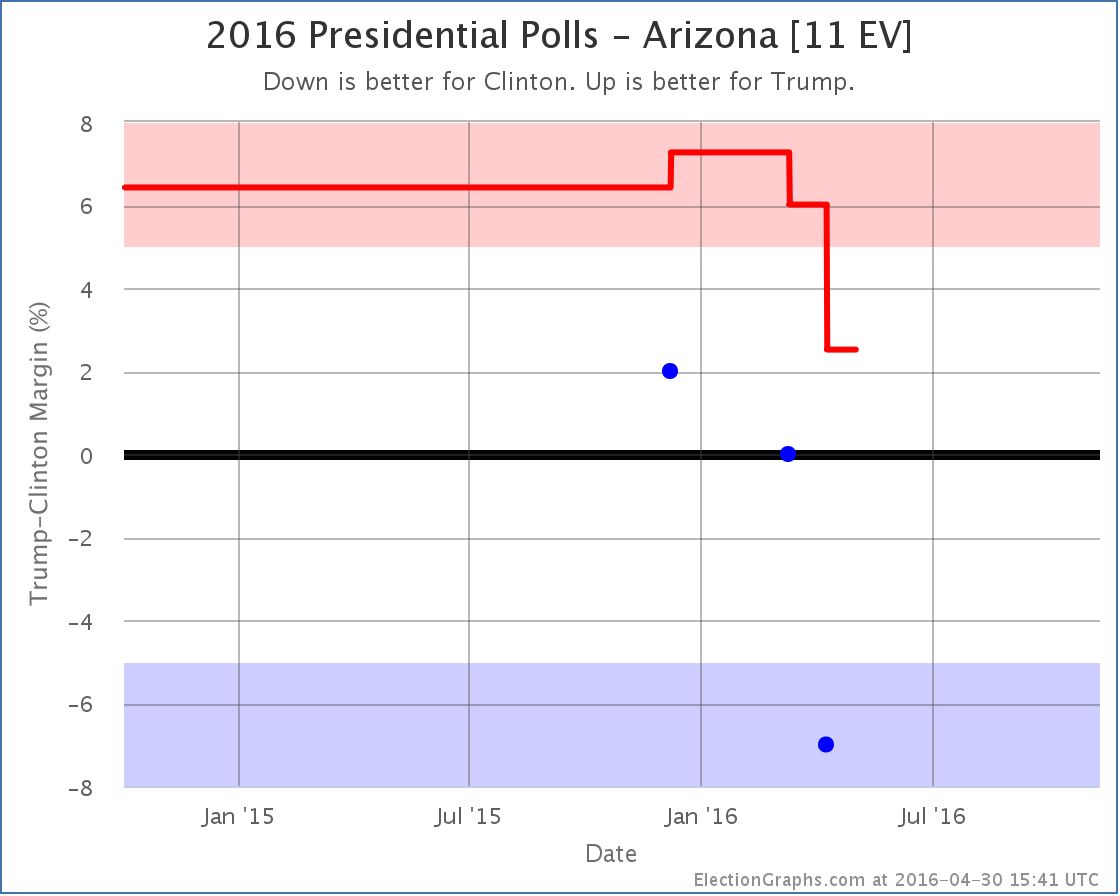
Arizona has been very lightly polled. There have only been three polls of Clinton vs Trump so far. So the average still includes the 2008 and 2012 election results. Each of the polls so far has been worse than the last for Trump though. The average now is only a 2.5% lead for Trump. With that, it is a “Weak Trump” state that is within reach for Clinton.
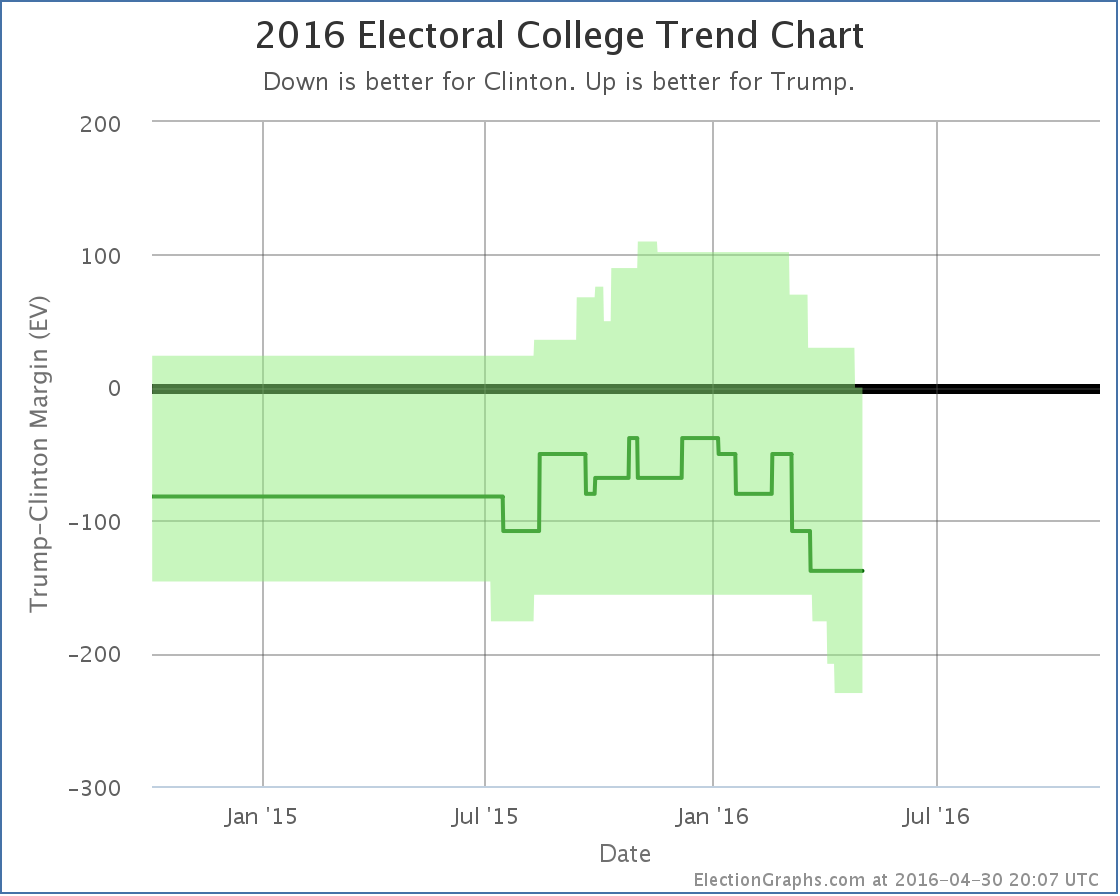
With these two changes, the overall trend in the expected range of possibilities looks like this:
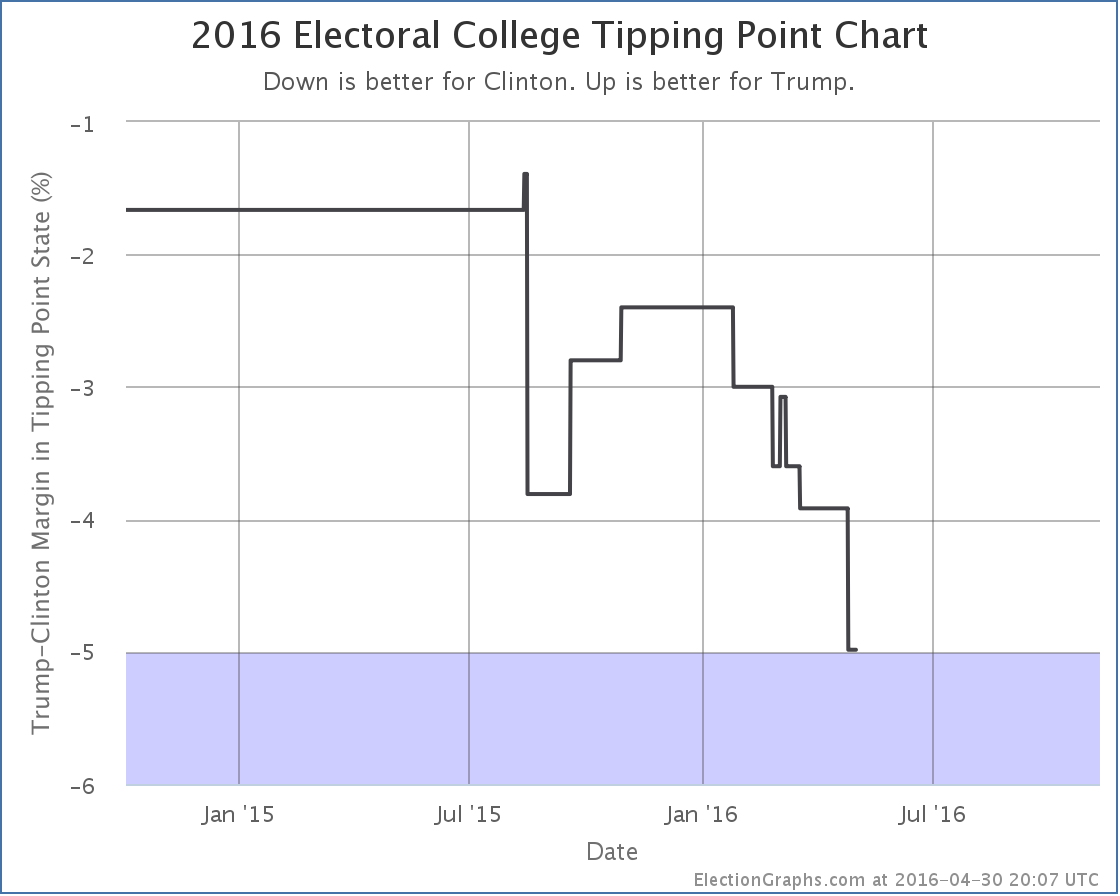
With North Carolina’s movement, the tipping point moved in Clinton’s direction as well:
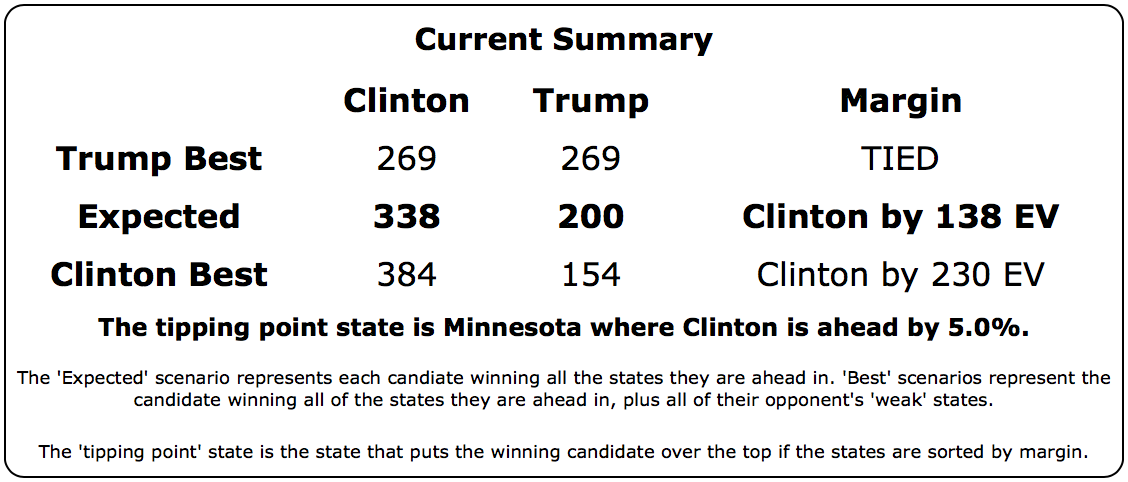
The downward trend that started around the New Year for Trump is continuing. The current summary now looks like this:
Yes, Clinton’s best case is better than it was with Arizona as a possible pickup.
But look at Trump’s current best case.
It is a 269 to 269 electoral college tie.
Can you even imagine a Clinton vs Trump race thrown into the House of Representatives? Wow.
Of course that won’t happen. But just like a contested convention, an electoral college tie is the kind of thing that gets political junkies excited. :-)
The bottom line on Clinton vs Trump is that after peaking around the New Year, Trump has been declining ever since. He is now at the point where if you give him not only all the states he is ahead in, but also the ones where Clinton is ahead by less than 5%, he only gets to a tie.
Things will undoubtedly change as both parties transition from primary mode to general election mode. The primary season has been very bad for Trump in terms of general election polling. The types of things he has been saying and doing that are winning him the Republican nomination are at the same time souring the general election voter against him.
The question is if he can turn that around once he is the official nominee. (Assuming nothing surprising happens to stop that of course.)
Clinton vs Cruz
Oh yeah, Cruz is still in this too.
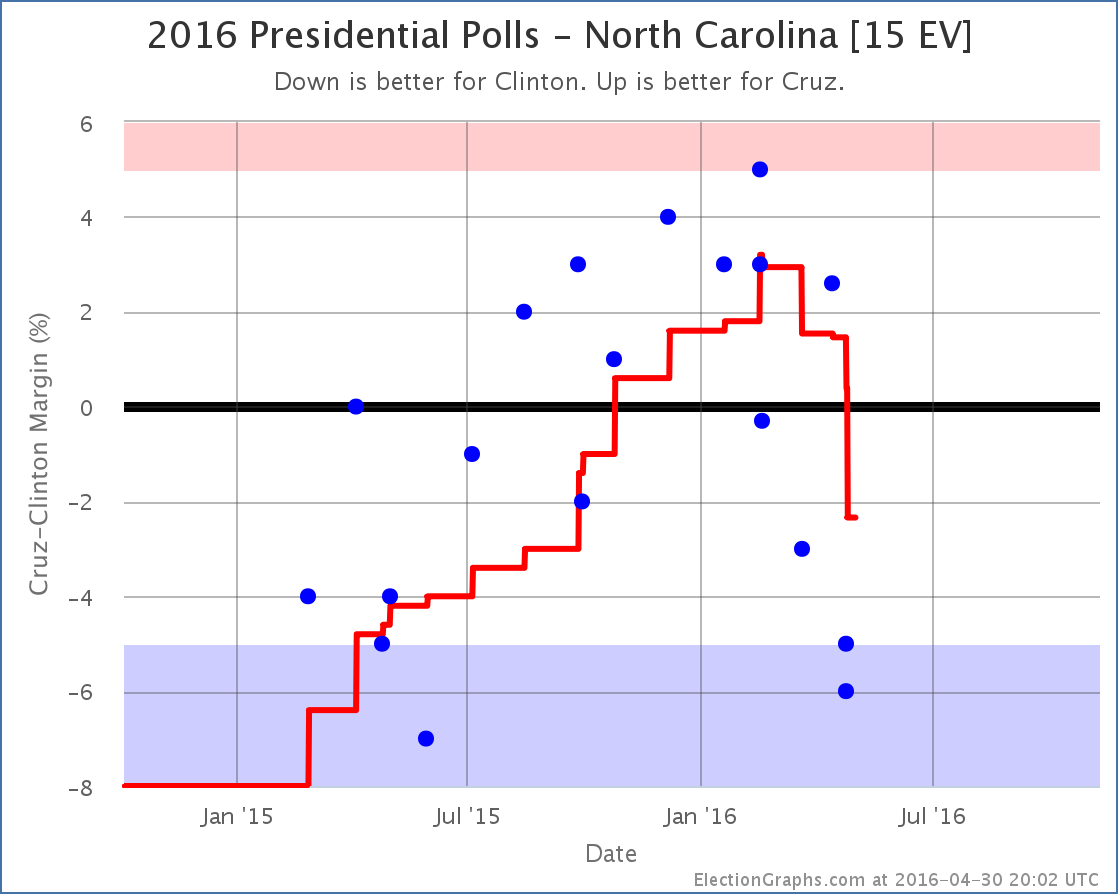
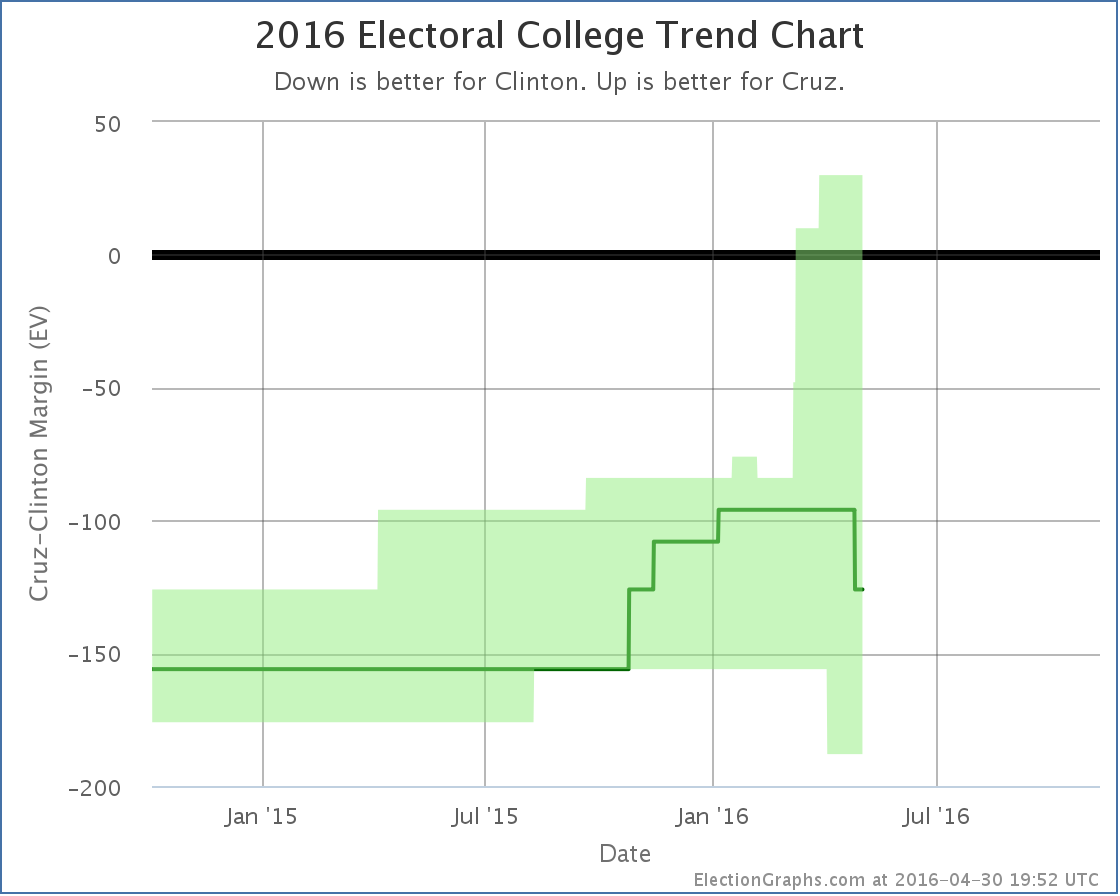
Cruz had been doing better and better in North Carolina. Until mid-March. Since then things have been moving against him. With this update, the lead in the state flips back to Clinton. This moves Cruz’s “expected case”:
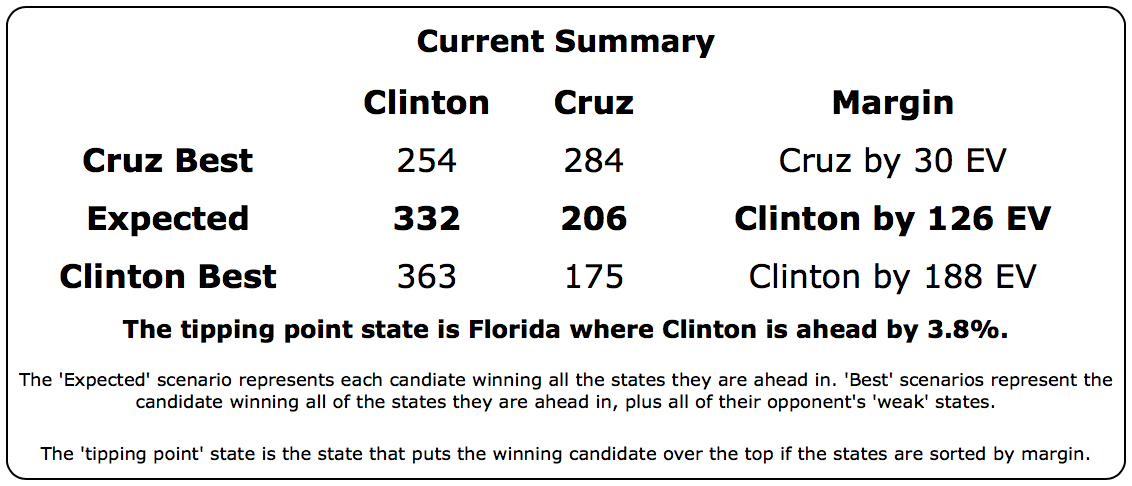
The new summary looks like this:
Notice that in all four of the key metrics, the expected case, the two best cases, and the tipping point, Cruz is doing better than Trump against Clinton.
Of course, Trump is on track to be the nominee and Cruz is not, absent some sort of coup at the convention via a rules change, a last minute Trump implosion, or something like that. Republican voters do not seem to be prioritizing “electability” this time around.
191.8 days until polls start closing on election day though. A lot will change between now and then. So we shall see…
Note: This post is an update based on the data on ElectionGraphs.com. Election Graphs tracks both a poll based estimate of the Electoral College and a numbers based look at the Delegate Races. All of the charts and graphs seen in this post are from that site. Additional graphs, charts and raw data can be found there. All charts above are clickable to go to the current version of the detail page the chart is from, which may contain more up to date information than the snapshots on this page, which were current as of the time of this post. Follow @ElectionGraphs on Twitter or like Election Graphs on Facebook to see announcements of updates or to join the conversation. For those interested in individual general election poll updates, follow @ElecCollPolls on Twitter for all the polls as they are added.
[Update 04:10 UTC to add the “Maybe everything is going Trump’s way…” sentence.]
[Update 04:52 UTC to add in some inexplicably missing words where a sentence stopped before it was complete.]
