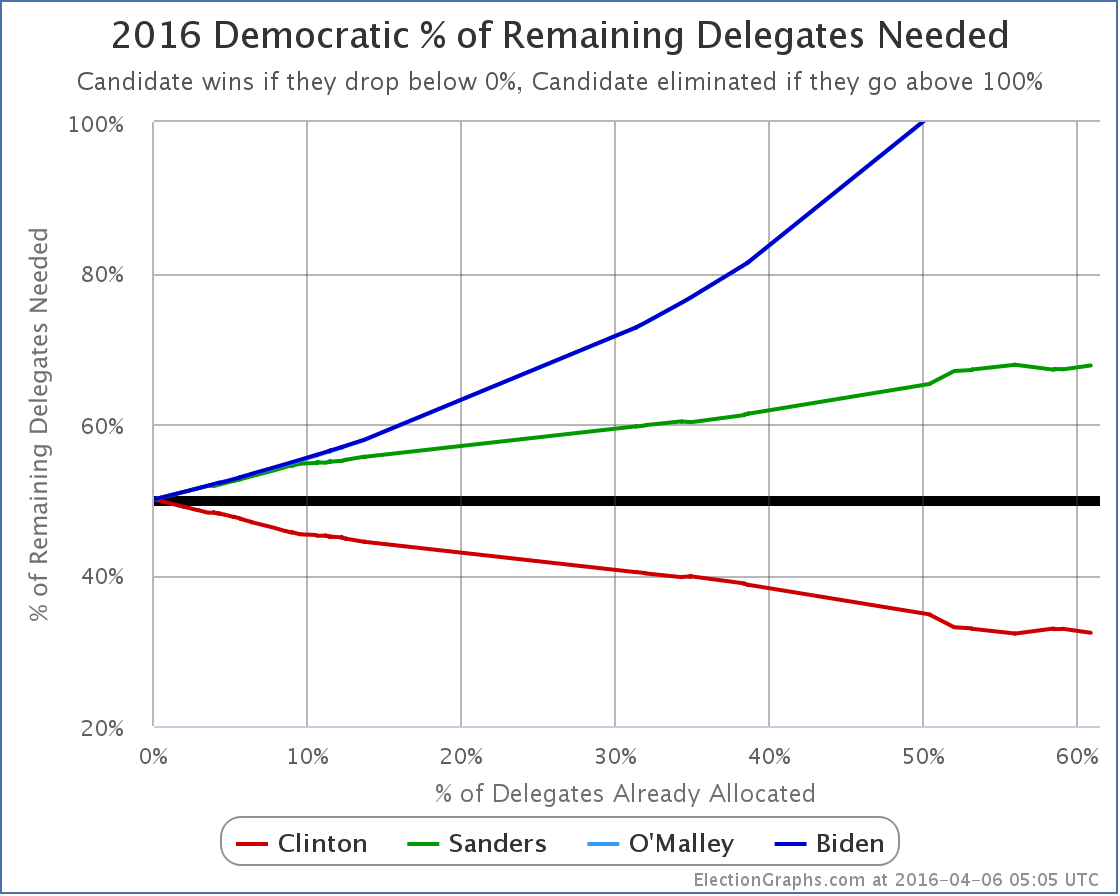
Sanders won Wisconsin. Sanders got 48 delegates to Clinton’s 38. That’s 55.8% of the delegates.
Add in superdelegates and other changes since Washington, Hawaii and Alaska and it becomes Sanders +48.5, Clinton +44. That’s 52.4% for Sanders.
But Sanders needed 67.0% of the delegates to actually get closer to the nomination given that the pool of remaining delegates is dwindling. So the percentage of the remaining delegates Sanders needs to catch up and win increases despite the win.
Before Washington, Hawaii, and Alaska, Sanders needed 67.84% of the remaining delegates to win. After his big wins in those contests, this declined to 67.03%. We’re now back to 67.76%. Sanders hasn’t lost all the ground he won, but he has lost most of it.
Winning states isn’t enough. To catch up Sanders would have to be routinely winning by massive margins. That hasn’t been happening.
In recent posts, I’ve also included calculations for an “if superdelegates didn’t exist” scenario. Even these show a very hard road for Sanders. Recently even some Sanders surrogates have started to acknowledge that catching Clinton in pledged delegates via primaries and caucuses may be a near impossible task.
Now the optimistic scenario for the Sanders camp seems to be that while they don’t catch Clinton in pledged delegates, they win so many states, are close enough, and have so much “momentum” that superdelegates going to Sanders would give him the nomination at the convention. Just a few weeks ago Sanders supporters were saying that superdelegates overturning the pledged delegate results would be a travesty of justice… but things change I guess.
We now essentially have even the Sanders camp saying the right way to look at the race is to include the superdelegates and their preferences. Because it is clear that any possible path to victory involves superdelegates.
Given that, there are about 207 superdelegates who have not yet expressed any preference that Sanders can woo. Just like delegates from primaries and caucuses, to be on a pace to catch up and win, Sanders needs to get over 67.76% of those delegates to come over to his side. Or, of course, he can try to convince some of the about 474 superdelegates who have already said they are supporting Clinton to change their minds.
So far there have not been any significant superdelegate moves toward Sanders.
If that does start to happen, you will of course see it here.
[Update 2016-04-08 17:57 UTC – Superdelegate scan plus updated results in Arizona and Kansas yield a net change of Clinton +2, Sanders +2. This does not substantially change the analysis above.]
[Update 2016-04-09 15:53 UTC – Superdelegate scan, net change: Sanders +4, Clinton -1.]
[Update 2016-04-10 14:59 UTC – Superdelegate scan, net change: Clinton +1, Sanders +1.]
Note: This post is an update based on the data on ElectionGraphs.com. Election Graphs tracks both a poll based estimate of the Electoral College and a numbers based look at the Delegate Races. All of the charts and graphs seen in this post are from that site. Additional graphs, charts and raw data can be found there. All charts above are clickable to go to the current version of the detail page the chart is from, which may contain more up to date information than the snapshots on this page, which were current as of the time of this post. Follow @ElectionGraphs on Twitter or like Election Graphs on Facebook to see announcements of updates or to join the conversation. For those interested in individual general election poll updates, follow @ElecCollPolls on Twitter for all the polls as they are added.

Leave a Reply
You must be logged in to post a comment.