As of when I started writing this post, the results from the March 15th contests on the Democratic side were:
Clinton +312, Sanders +251, TBD 128*
In addition, since the last post other revisions netted: Clinton +3, Sanders +1.
So of the delegates allocated since that last update, Clinton got 55.6%. She only needed 38.90% of the delegates to be on pace to win.
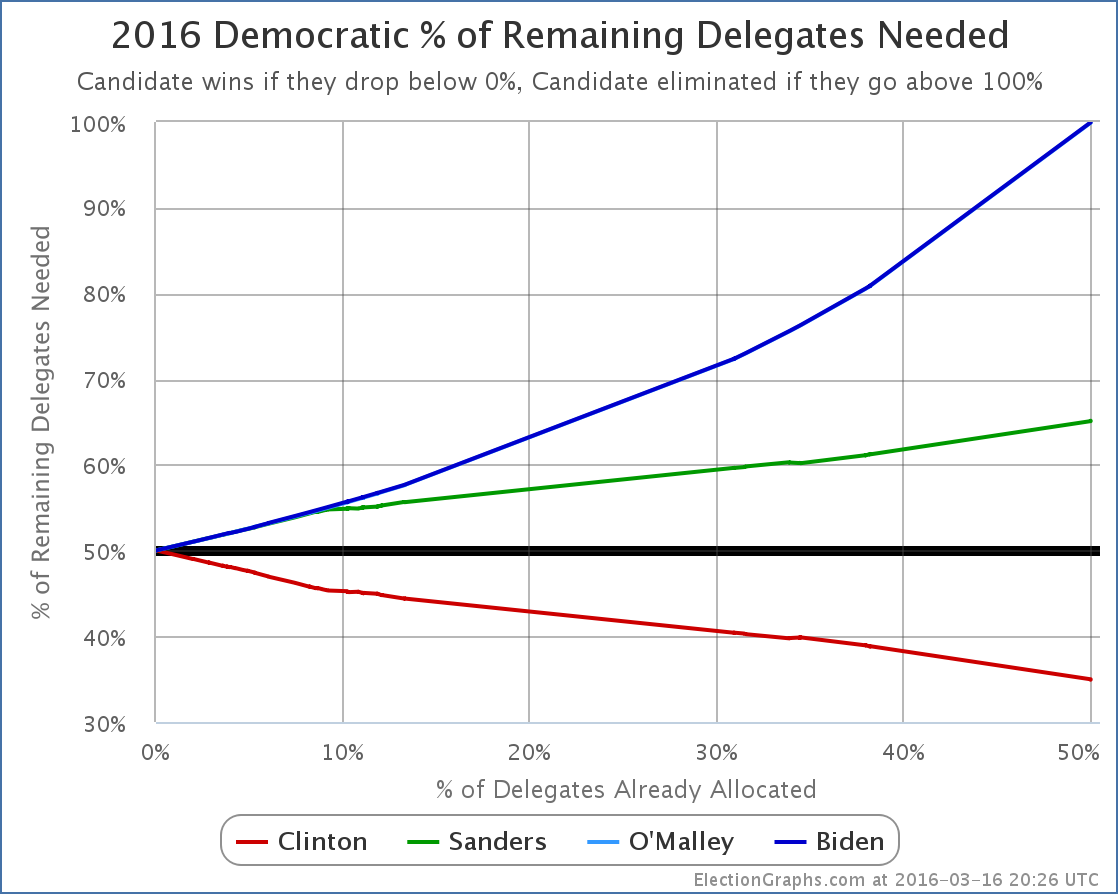
So the updated “% of remaining needed to win” graph looks like this…
Clinton only needs 34.94% of the remaining delegates to win.
Of course, if massive numbers of superdelegates start changing their minds, that number would get higher. Enough superdelegates flipping could in fact still put Sanders in the lead!
But superdelegates haven’t been changing their minds in significant numbers yet.
And so Clinton’s delegate accumulation continues.
* I waited awhile before writing this post because the final disposition of 64 delegates each from Florida and Illinois is still undetermined as per my source (Green Papers). But at some point I had to go ahead with what I had. Those delegates are likely to split along the same lines as the other delegates from those states though, and they are unlikely to change the overall picture. If there are additional updates for those delegates before the results from Arizona, Idaho and Utah come in, I will add updates to the post with those results.
[Update 2016-03-17 00:30 UTC – And here is the first of those updates. With updates to both Florida and Illinois, Clinton added 64 more delegates, and Sanders added 11. All 64 TBD delegates from Florida are now accounted for. There are still 53 delegates TBD in Illinois. Clinton now only needs 33.30% of the remaining delegates, while Sanders needs 66.78%. In addition, with this update O’Malley is officially mathematically eliminated.]
[Update 2016-03-18 05:20 UTC – Update today for both Illinois and Ohio. Net result Clinton gained another 21 delegates, Sanders gained 32. There are no more TBD delegates remaining. Clinton now needs 33.16% of the remaining delegates while Sanders needs 66.93%.]
[Update 2016-03-18 05:41 UTC – Superdelegate scan, Net: Clinton -1]
[Update 2016-03-20 16:12 UTC – Superdelegate scan, Net: Clinton +1]
[Update 2016-03-22 11:27 UTC – Superdelegate scan: Net: Clinton +5, Sanders +0.5 (Democrats Abroad superdelegates get half a vote)]
Note: This post is an update based on the data on ElectionGraphs.com. Election Graphs tracks both a poll based estimate of the Electoral College and a numbers based look at the Delegate Races. All of the charts and graphs seen in this post are from that site. Additional graphs, charts and raw data can be found there. All charts above are clickable to go to the current version of the detail page the chart is from, which may contain more up to date information than the snapshots on this page, which were current as of the time of this post. Follow @ElectionGraphs on Twitter or like Election Graphs on Facebook to see announcements of updates or to join the conversation. For those interested in individual general election poll updates, follow @ElecCollPolls on Twitter for all the polls as they are added.
[Update 2016-03-17 15:45 UTC to correct slight error in the second decimal place of the “needs” numbers for Clinton and Sanders in the 2016-03-17 00:30 UTC update note.]


