Saturday brought Republican results for DC, Guam and Wyoming. The number of delegates coming out of this was small, turnout was tiny, and there had been no polling. But the results were surprisingly bad for Trump. Between these three we ended up with:
Rubio +11, Cruz +10, Kasich +9, Trump +1
This by the way is much worse for Trump than the model in my last post predicted, since it used national polls in the absence of actual polls for these three places.
There were also 9 “uncommitted” delegates selected yesterday. These people essentially become like the Democratic superdelegates, in that they are free agents at the convention. If I find out their preferences, I’ll assign them to the candidate they support, but for now they remain TBD. With all the contests so far there are actually 22 of these now. It will be interesting to see if they make a difference.
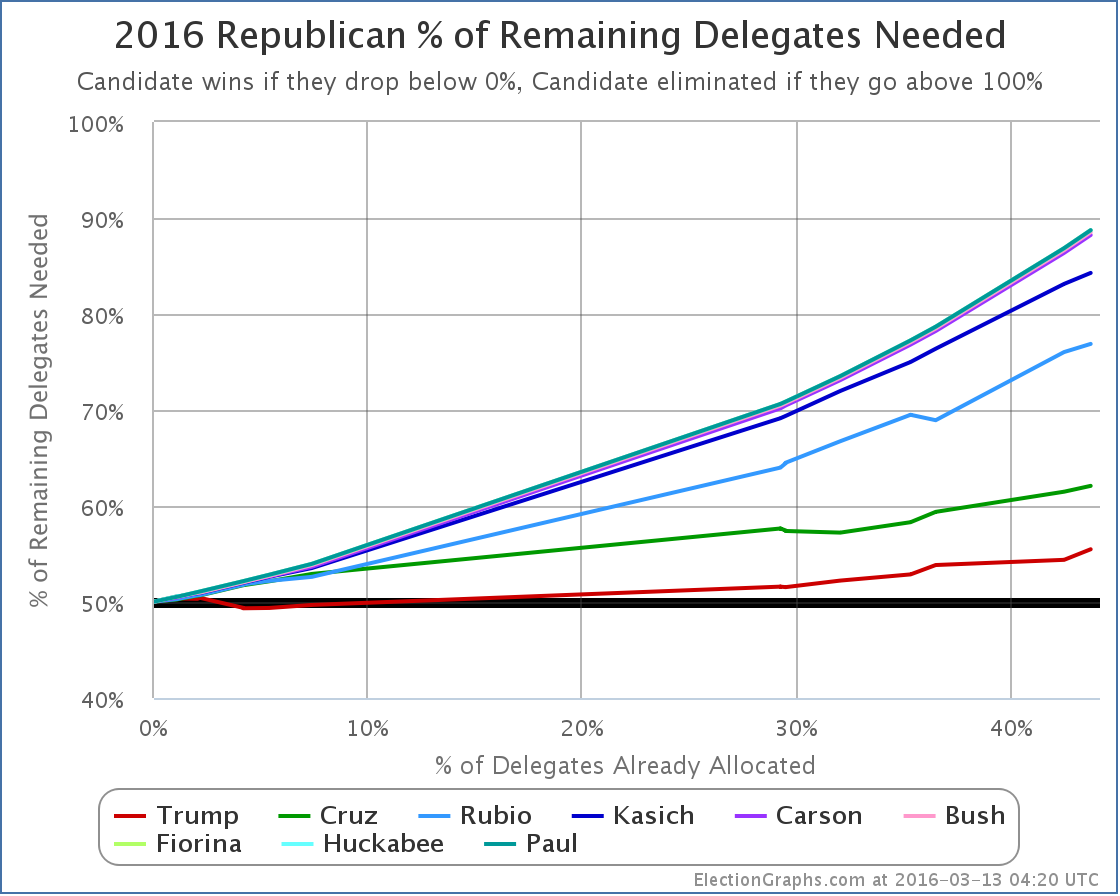
In any case, with only 1 of 30 delegates from Saturday, or 3.33%, Trump fell very far short of the 54.39% of the delegates he needed to be on the path to an outright win instead of a contested convention.
Trump now needs 55.49% of the remaining delegates to win outright. This number is getting high. And the gap between what Trump has done so far (42.96% of delegates) is getting larger. Nobody else got what they needed either of course, so everybody’s numbers got worse, not just Trump’s.
Of course, we still have some big winner take all and winner take most states coming up, so time to refresh the poll based predictions for Tuesday and see what they look like now. As usual, using RCP poll averages and delegate distribution rules from Green Papers.
Florida – 99 delegates – March 15th:
- Poll averages: Trump 41.4%, Rubio 23.3%, Cruz 19.7%, Kasich 9.6%
- Delegate estimate: Trump 99
North Carolina – 72 delegates – March 15th:
- Poll averages: Trump 35.6%, Cruz 23.8%, Rubio 13.0%, Kasich 10.4%
- Delegate estimate: Trump 31, Cruz 21, Rubio 11, Kasich 9
Illinois – 69 delegates – March 15th:
- Poll averages: Trump 34.3%, Cruz 25.3%, Kasich 18.3%, Rubio 14.8%
- Delegate estimate: Trump 35, Cruz 15, Kasich 11, Rubio 8
Ohio – 66 delegates – March 15th:
- Poll averages: Kasich 35.3%, Trump 33.3%, Cruz 20.0%, Rubio 5.8%
- Delegate estimate: Kasich 66
Missouri – 52 delegates – March 15th:
- Using only recent poll: Trump 36.0%, Cruz 29.0%, Rubio 9.0%, Kasich 8.0%
- Delegate estimate: Trump 52
Northern Marianas – 9 delegates – March 15th:
- No polls, using national avg: Trump 36.0%, Cruz 21.8%, Rubio 18.0%, Kasich 12.0%
- Delegate estimate: Trump 9
The main difference from the estimate a few days ago is that now Kasich is ahead in Ohio, and wins the 66 delegates there. This makes a big difference.
Adding these up:
Trump +226, Kasich +86, Cruz +36, Rubio +19
Trump would get 61.6% of the delegates on Tuesday. Which even without Ohio would be above the 55.49% he needs to be tracking toward a clean win.
The new totals would be:
Trump 690, Cruz 408, Rubio 185, Kasich 149, Others 15
Trump would have 47.7% of the delegates. Still not a majority.
When you do all the math at the end of all that, Trump would need 53.37% of the remaining delegates to cleanly win a majority of the delegates. That would still be a substantial improvement from what he had been doing so far.
But there would be more winner take all states coming up. And Cruz, Rubio and Kasich would be so far behind that the scenarios where they would catch up would be extremely far fetched. None of them can win outright. At best they can block Trump. Do all three of them stay in? Do their donors continue to support them in a bid where the only real goal is a contested convention? Can they really keep blocking him from getting a majority of the delegates through a long slog from now until June 7th?
The “Trump wins Florida, but loses Ohio” scenario is the one where it would be premature to say either “Trump will win this outright”, or “Contested Convention”. Instead, we’ll still be hovering between those possibilities, waiting for more states to weigh in.
This might go on awhile.
Finally, as I did with the Democrats earlier, a quick look back, comparing Trump today with Romney in 2012 and McCain in 2008.
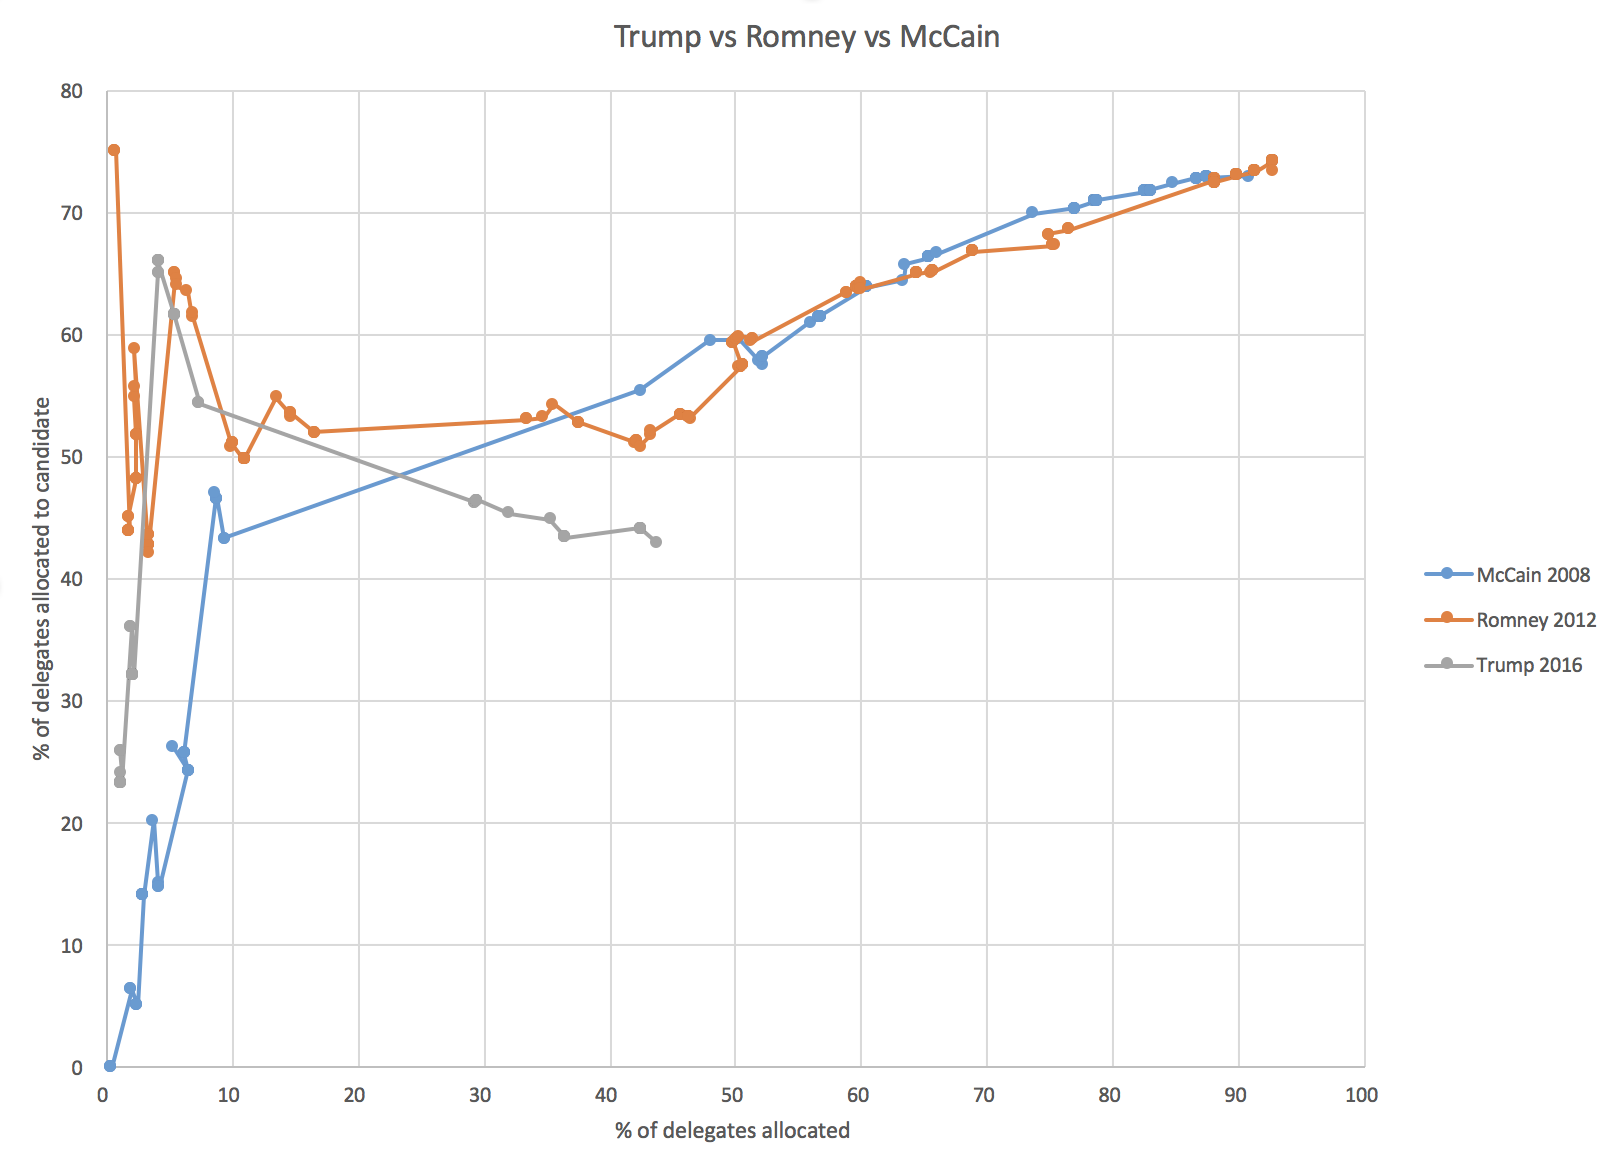
First, just looking at the percent of delegates they had as the race progressed:
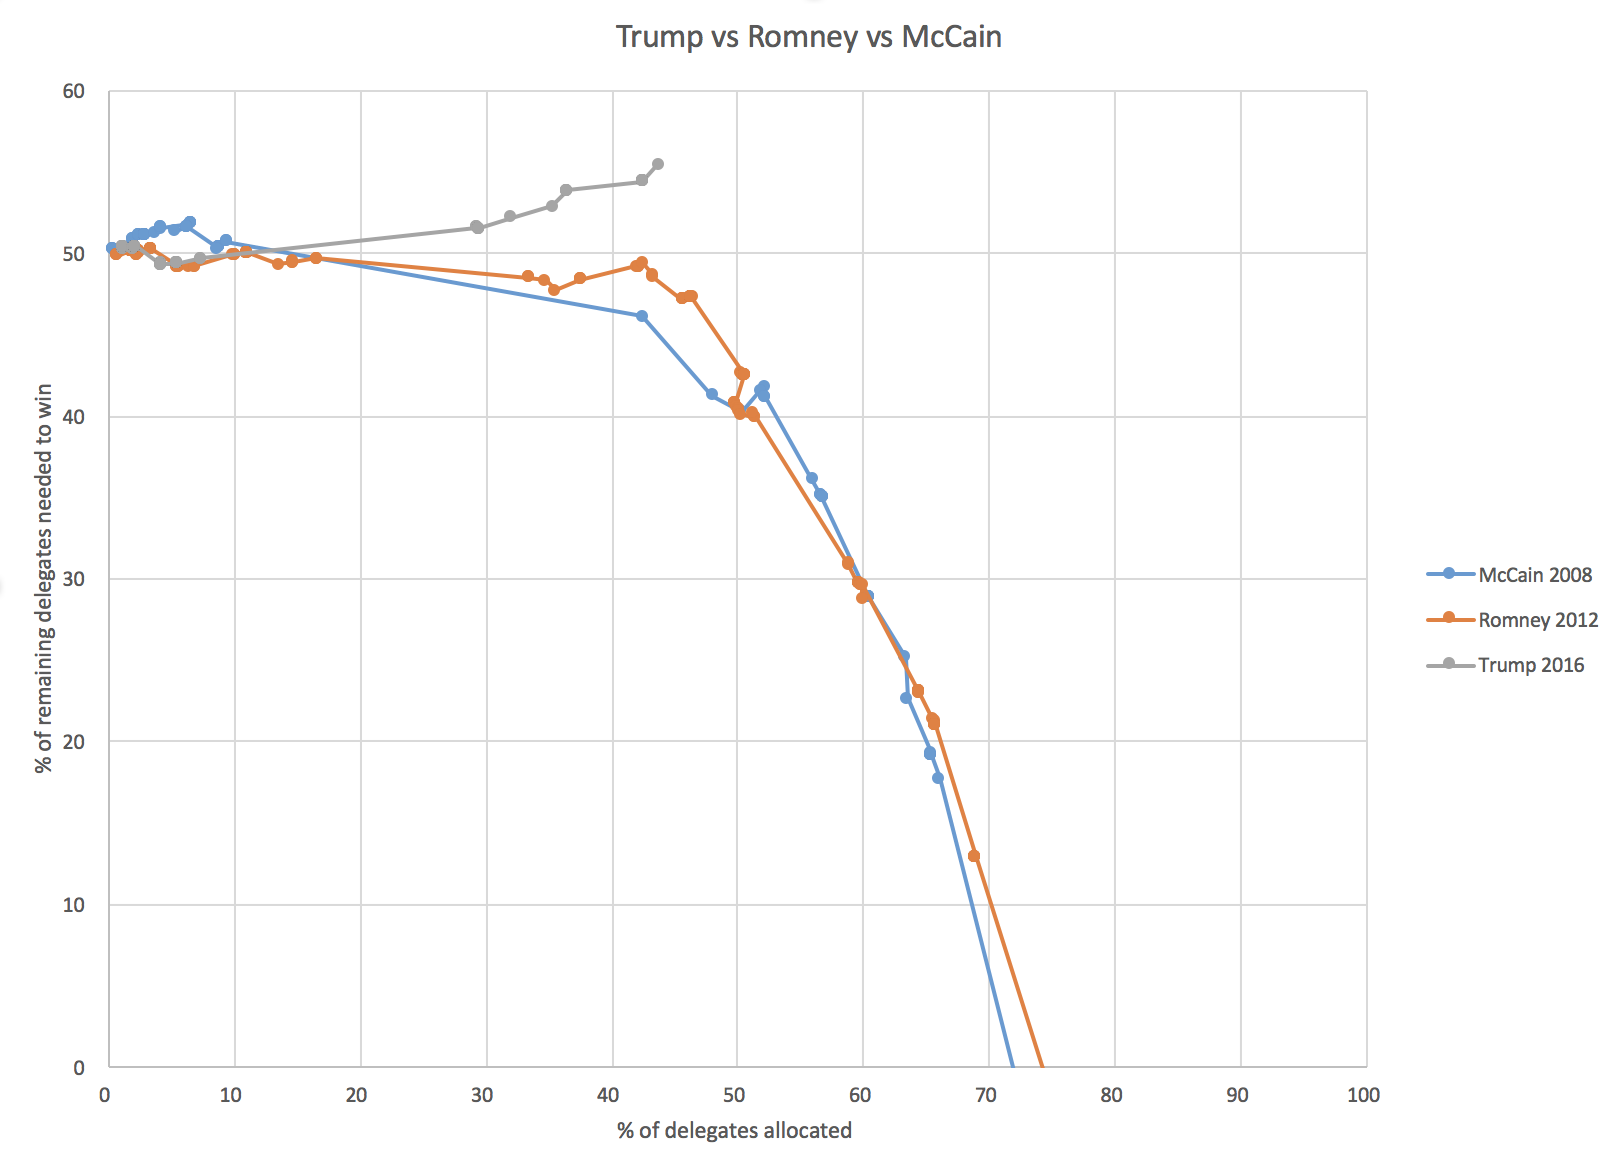
You can see that Trump is behind where either McCain or Romney were at about the same point in the race. But as I’ve said many times, percentages of delegates so far is the wrong way to look at things. Instead, you want to look at the % of the remaining delegates that are needed:
You can see that at this point in the race, both Romney and McCain needed less than 50% of the remaining delegates to win. Trump is way behind that pace. But it was also not until right around now in the races that McCain and Romney really started to pull away. Trump has a harder road here, but with a handful of big winner take all states it is not too late for him to start a downward dive to a flat out win.
But if his line doesn’t manage a full on turn downward, eventually it will curve up, and we’ll end up at the contested convention.
Ohio is close. We will have to wait until Tuesday to see how this thing is going…
Note: This post is an update based on the data on ElectionGraphs.com. Election Graphs tracks both a poll based estimate of the Electoral College and a numbers based look at the Delegate Races. All of the charts and graphs seen in this post are from that site. Additional graphs, charts and raw data can be found there. All charts above are clickable to go to the current version of the detail page the chart is from, which may contain more up to date information than the snapshots on this page, which were current as of the time of this post. Follow @ElectionGraphs on Twitter or like Election Graphs on Facebook to see announcements of updates or to join the conversation. For those interested in individual general election poll updates, follow @ElecCollPolls on Twitter for all the polls as they are added.
[Edit 22:17 UTC to add sentence about other candidate’s numbers getting worse, not just Trump’s.]
[Edit 22:32 UTC to add link to the post on the Democrats.]


.@FHQ Recently you were comparing 2016 w/ 2008 & 2012. Thought you might like these graphs. https://t.co/3vXAHUUkBd https://t.co/RcVMgycfkL
RT @abulsme: .@FHQ Recently you were comparing 2016 w/ 2008 & 2012. Thought you might like these graphs. https://t.co/3vXAHUUkBd https://t.…
RT @abulsme: .@FHQ Recently you were comparing 2016 w/ 2008 & 2012. Thought you might like these graphs. https://t.co/3vXAHUUkBd https://t.…
RT @abulsme: .@FHQ Recently you were comparing 2016 w/ 2008 & 2012. Thought you might like these graphs. https://t.co/3vXAHUUkBd https://t.…
RT @abulsme: .@FHQ Recently you were comparing 2016 w/ 2008 & 2012. Thought you might like these graphs. https://t.co/3vXAHUUkBd https://t.…
RT @abulsme: .@FHQ Recently you were comparing 2016 w/ 2008 & 2012. Thought you might like these graphs. https://t.co/3vXAHUUkBd https://t.…
RT @abulsme: .@FHQ Recently you were comparing 2016 w/ 2008 & 2012. Thought you might like these graphs. https://t.co/3vXAHUUkBd https://t.…
@abulsme @adrian_gray @FHQ https://t.co/g6vdT5ny4e
RT @abulsme: .@FHQ Recently you were comparing 2016 w/ 2008 & 2012. Thought you might like these graphs. https://t.co/3vXAHUUkBd https://t.…
RT @abulsme: .@FHQ Recently you were comparing 2016 w/ 2008 & 2012. Thought you might like these graphs. https://t.co/3vXAHUUkBd https://t.…
RT @abulsme: .@FHQ Recently you were comparing 2016 w/ 2008 & 2012. Thought you might like these graphs. https://t.co/3vXAHUUkBd https://t.…
@abulsme @FHQ also why FL and OH are so important.
RT @abulsme: .@FHQ Recently you were comparing 2016 w/ 2008 & 2012. Thought you might like these graphs. https://t.co/3vXAHUUkBd https://t.…
RT @abulsme: .@FHQ Recently you were comparing 2016 w/ 2008 & 2012. Thought you might like these graphs. https://t.co/3vXAHUUkBd https://t.…
RT @abulsme: .@FHQ Recently you were comparing 2016 w/ 2008 & 2012. Thought you might like these graphs. https://t.co/3vXAHUUkBd https://t.…
RT @abulsme: .@FHQ Recently you were comparing 2016 w/ 2008 & 2012. Thought you might like these graphs. https://t.co/3vXAHUUkBd https://t.…
@abulsme @adrian_gray @FHQ Anti-Trump sentiment continues to solidify, #NeverTrump is working!
RT @abulsme: .@FHQ Recently you were comparing 2016 w/ 2008 & 2012. Thought you might like these graphs. https://t.co/3vXAHUUkBd https://t.…
RT @abulsme: .@FHQ Recently you were comparing 2016 w/ 2008 & 2012. Thought you might like these graphs. https://t.co/3vXAHUUkBd https://t.…
RT @abulsme: .@FHQ Recently you were comparing 2016 w/ 2008 & 2012. Thought you might like these graphs. https://t.co/3vXAHUUkBd https://t.…
RT @abulsme: .@FHQ Recently you were comparing 2016 w/ 2008 & 2012. Thought you might like these graphs. https://t.co/3vXAHUUkBd https://t.…
RT @abulsme: .@FHQ Recently you were comparing 2016 w/ 2008 & 2012. Thought you might like these graphs. https://t.co/3vXAHUUkBd https://t.…
@abulsme Cool stuff!
RT @ElectionGraphs: [Blog Post] Republicans: A look back at Saturday, forward at Tuesday, and back again at Romney and McCain https://t.co/…
RT @abulsme: .@FHQ Recently you were comparing 2016 w/ 2008 & 2012. Thought you might like these graphs. https://t.co/3vXAHUUkBd https://t.…
RT @abulsme: .@FHQ Recently you were comparing 2016 w/ 2008 & 2012. Thought you might like these graphs. https://t.co/3vXAHUUkBd https://t.…
RT @abulsme: .@FHQ Recently you were comparing 2016 w/ 2008 & 2012. Thought you might like these graphs. https://t.co/3vXAHUUkBd https://t.…
@abulsme Oh, these are cool. Thanks for sharing.
RT @abulsme: .@FHQ Recently you were comparing 2016 w/ 2008 & 2012. Thought you might like these graphs. https://t.co/3vXAHUUkBd https://t.…
RT @abulsme: .@FHQ Recently you were comparing 2016 w/ 2008 & 2012. Thought you might like these graphs. https://t.co/3vXAHUUkBd https://t.…
RT @abulsme: .@FHQ Recently you were comparing 2016 w/ 2008 & 2012. Thought you might like these graphs. https://t.co/3vXAHUUkBd https://t.…
RT @abulsme: .@FHQ Recently you were comparing 2016 w/ 2008 & 2012. Thought you might like these graphs. https://t.co/3vXAHUUkBd https://t.…
RT @abulsme: .@FHQ Recently you were comparing 2016 w/ 2008 & 2012. Thought you might like these graphs. https://t.co/3vXAHUUkBd https://t.…
RT @abulsme: .@FHQ Recently you were comparing 2016 w/ 2008 & 2012. Thought you might like these graphs. https://t.co/3vXAHUUkBd https://t.…
RT @abulsme: .@FHQ Recently you were comparing 2016 w/ 2008 & 2012. Thought you might like these graphs. https://t.co/3vXAHUUkBd https://t.…
RT @abulsme: .@FHQ Recently you were comparing 2016 w/ 2008 & 2012. Thought you might like these graphs. https://t.co/3vXAHUUkBd https://t.…
RT @abulsme: .@FHQ Recently you were comparing 2016 w/ 2008 & 2012. Thought you might like these graphs. https://t.co/3vXAHUUkBd https://t.…
RT @abulsme: .@FHQ Recently you were comparing 2016 w/ 2008 & 2012. Thought you might like these graphs. https://t.co/3vXAHUUkBd https://t.…
RT @abulsme: .@FHQ Recently you were comparing 2016 w/ 2008 & 2012. Thought you might like these graphs. https://t.co/3vXAHUUkBd https://t.…
RT @abulsme: .@FHQ Recently you were comparing 2016 w/ 2008 & 2012. Thought you might like these graphs. https://t.co/3vXAHUUkBd https://t.…
RT @abulsme: .@FHQ Recently you were comparing 2016 w/ 2008 & 2012. Thought you might like these graphs. https://t.co/3vXAHUUkBd https://t.…
RT @abulsme: .@FHQ Recently you were comparing 2016 w/ 2008 & 2012. Thought you might like these graphs. https://t.co/3vXAHUUkBd https://t.…
RT @abulsme: .@FHQ Recently you were comparing 2016 w/ 2008 & 2012. Thought you might like these graphs. https://t.co/3vXAHUUkBd https://t.…
These graphs from .@abulsme comparing Trump’s delegate pace to Romney (2012) and McCain (2008) made my night: https://t.co/3vezuO4VJ7
RT @beltzner: These graphs from .@abulsme comparing Trump’s delegate pace to Romney (2012) and McCain (2008) made my night: https://t.co/3v…
RT @abulsme: .@FHQ Recently you were comparing 2016 w/ 2008 & 2012. Thought you might like these graphs. https://t.co/3vXAHUUkBd https://t.…
RT @abulsme: .@FHQ Recently you were comparing 2016 w/ 2008 & 2012. Thought you might like these graphs. https://t.co/3vXAHUUkBd https://t.…
Source: https://t.co/8auYJOEdX5
RT @abulsme: .@FHQ Recently you were comparing 2016 w/ 2008 & 2012. Thought you might like these graphs. https://t.co/3vXAHUUkBd https://t.…
Brandy Donaghy liked this on Facebook.
Bruce Morton liked this on Facebook.
RT @abulsme: .@FHQ Recently you were comparing 2016 w/ 2008 & 2012. Thought you might like these graphs. https://t.co/3vXAHUUkBd https://t.…
@abulsme @FHQ They didn’t have as many early proportional states!!
RT @abulsme: .@FHQ Recently you were comparing 2016 w/ 2008 & 2012. Thought you might like these graphs. https://t.co/3vXAHUUkBd https://t.…
RT @abulsme: .@FHQ Recently you were comparing 2016 w/ 2008 & 2012. Thought you might like these graphs. https://t.co/3vXAHUUkBd https://t.…
RT @abulsme: .@FHQ Recently you were comparing 2016 w/ 2008 & 2012. Thought you might like these graphs. https://t.co/3vXAHUUkBd https://t.…
RT @abulsme: .@FHQ Recently you were comparing 2016 w/ 2008 & 2012. Thought you might like these graphs. https://t.co/3vXAHUUkBd https://t.…