Since my last Electoral College blog post there have been new polls in New York, Florida, New Jersey, Ohio and Pennsylvania. There were notable changes for two candidate pairs. But for both of them, the news was mixed. Lets take a look:
Clinton vs Trump
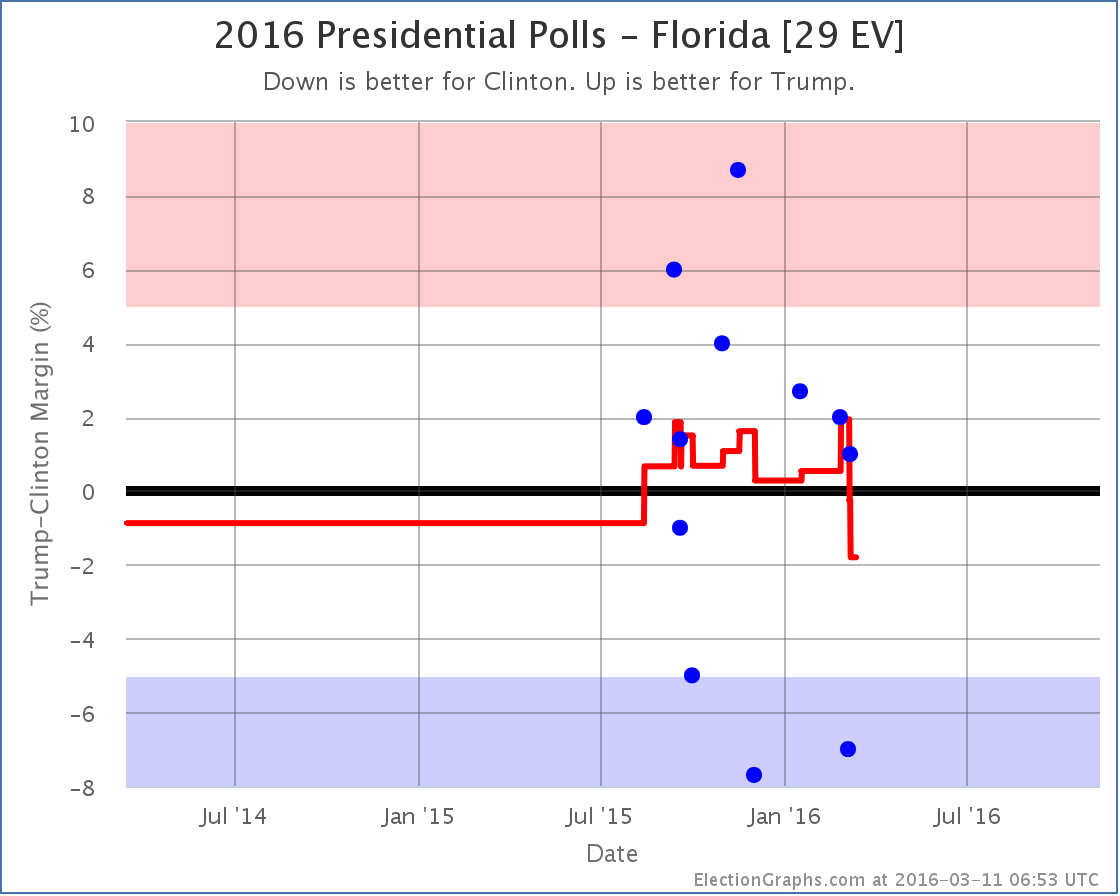
With some strong polls from last fall rolling off the average, Florida flips from “Weak Trump” to “Weak Clinton” with the state now sitting at a 1.8% Clinton lead. This is still a very “close could go either way” result, but it puts Florida on Clinton’s side of the fence so she gets Florida’s 29 electoral votes in her “Expected” case:
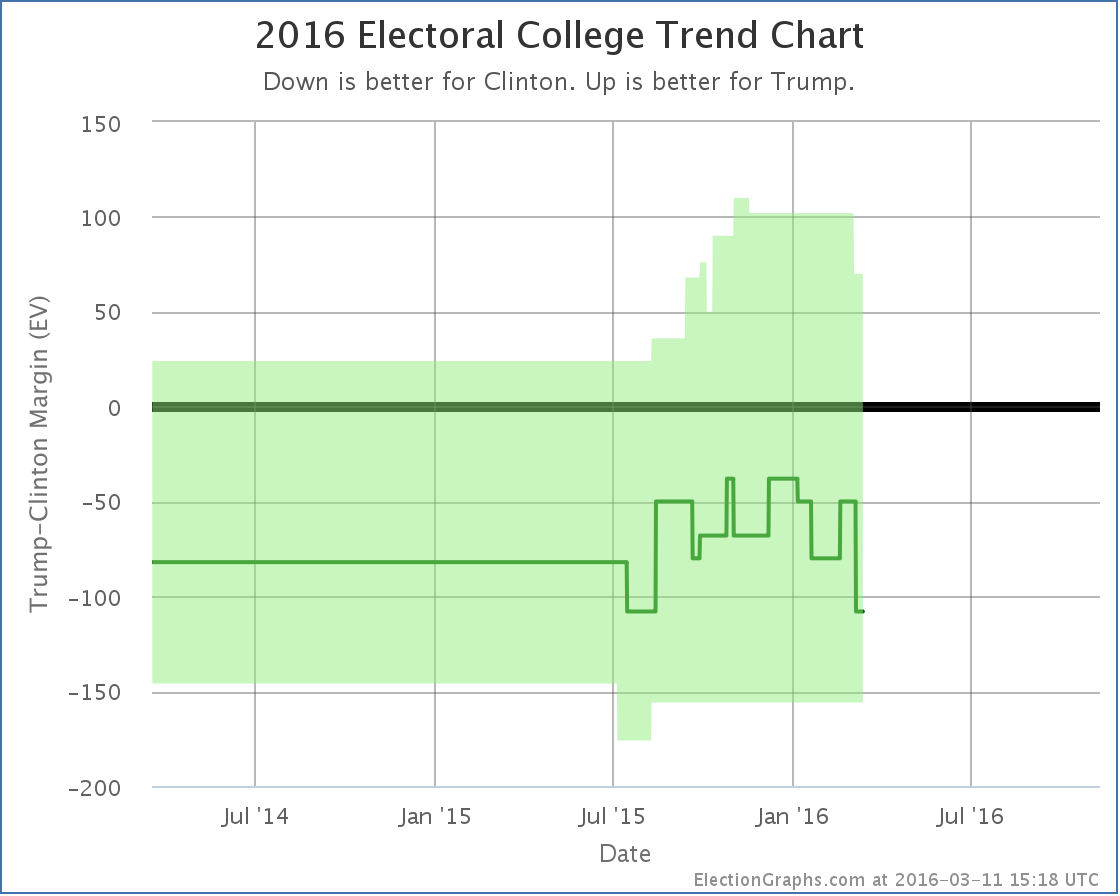
Florida is a big state and makes a big difference. The expected result is now a 108 electoral vote win by Clinton. But it is important to remember that given all the close states that could easily move, anything from Clinton by 156 to Trump by 70 is very easy to imagine given the current polling.
But there was movement for Trump in the other direction too. He improved in Pennsylvania, and while it didn’t change the status of Pennsylvania (Weak Clinton) it did move Trump’s tipping point:
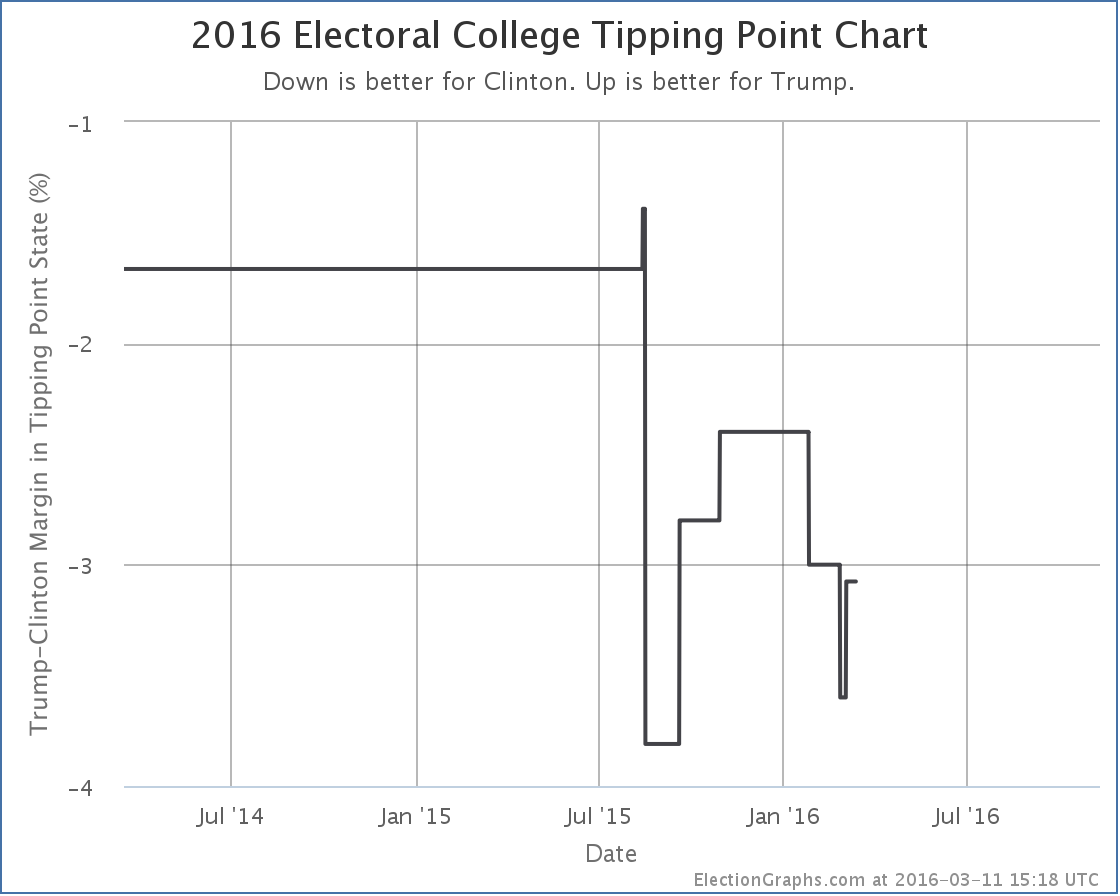
After a very brief dip lower, Trump’s tipping point pops back up to being behind Clinton by only 3.1%. Remember, the tipping point essentially represents how far ahead or behind a candidate is nationally, but adjusted for the effects of the electoral college.
So Trump’s “expected” result gets a little bit worse, but the amount he has to move polls to flip that result to a win gets a little smaller.
Clinton vs Cruz
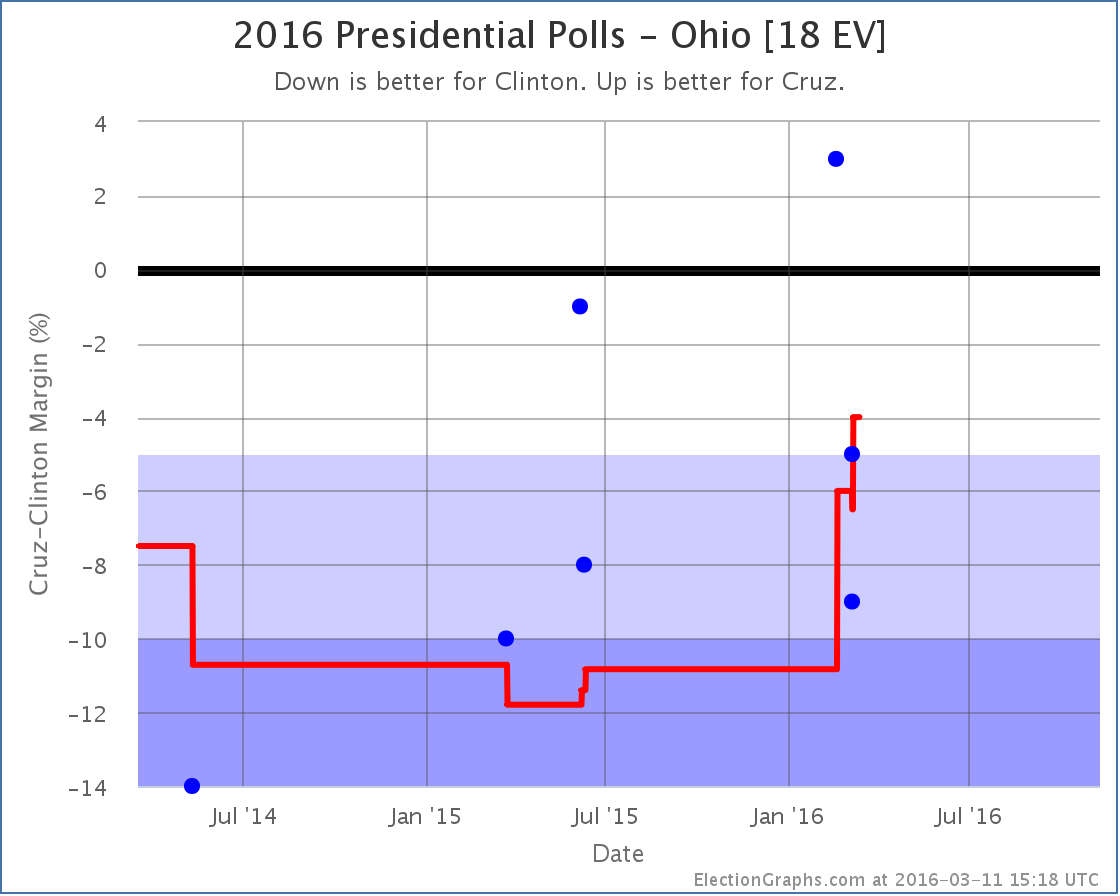
While Trump was weakening in Florida, Cruz’s poll average was improving in Ohio. He is now behind Clinton by only 4.0%. She still leads, but this is close enough for me to consider Ohio a swing state and a possible pick up for Cruz, which improves his “best case”…
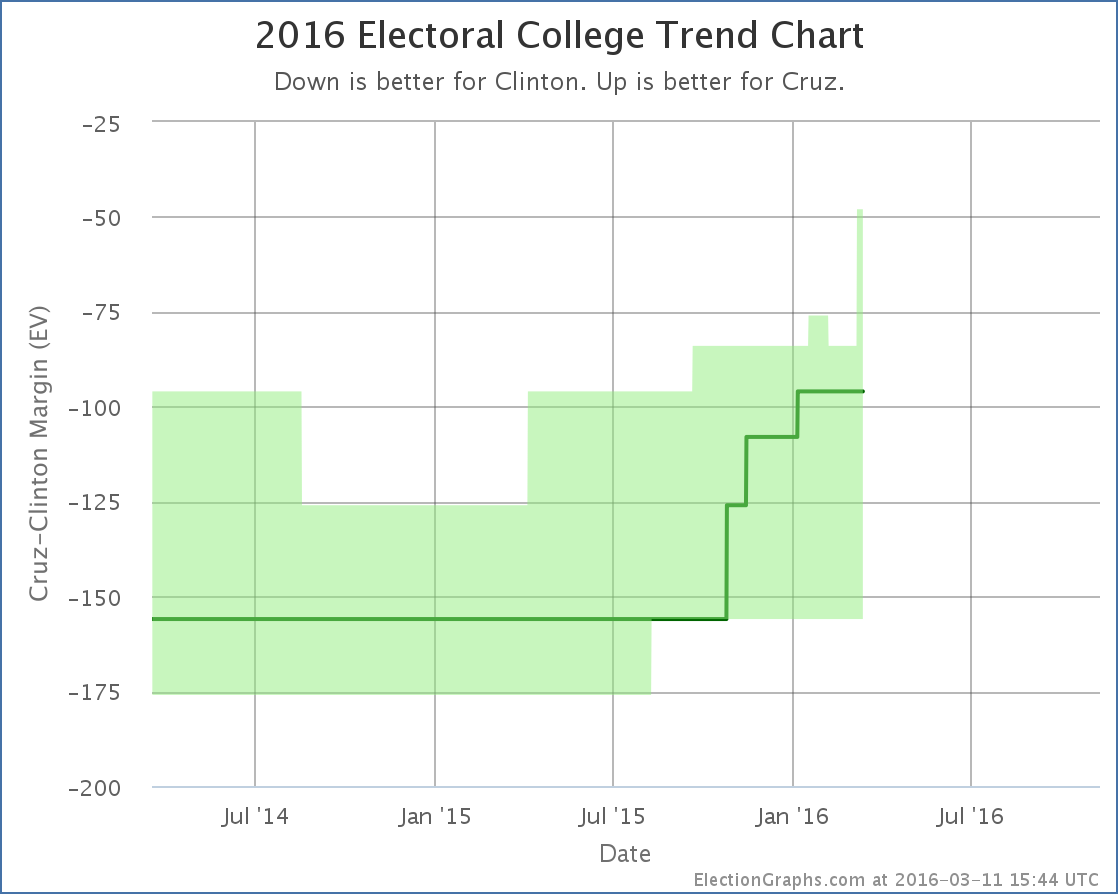
Now if Cruz wins all the states he is ahead in, plus flips Nevada and Ohio where he is close… he loses by only 48 electoral votes.
But still, it is an improvement. And Cruz has been on an improving trend for about a year now. If it continues, he might eventually be competitive.
On this metric anyway. As with Trump above, his tipping point also moves, but in the opposite direction:
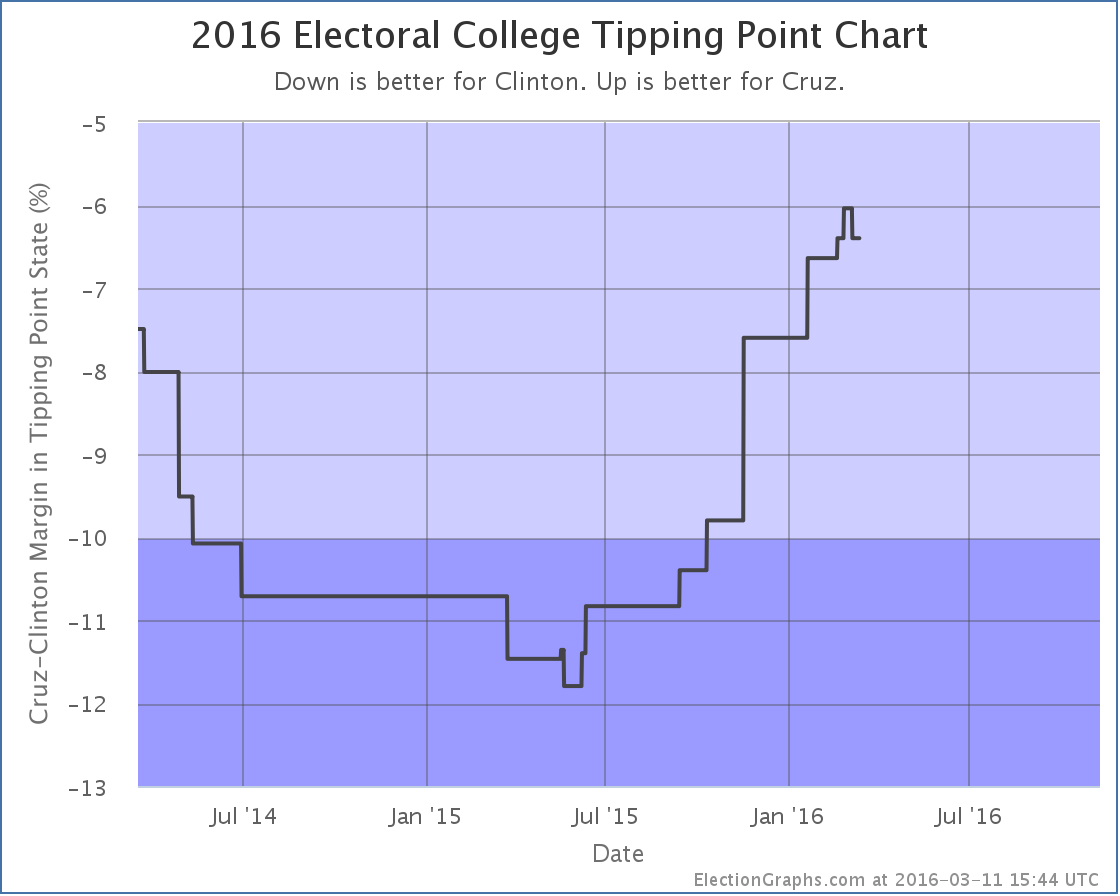
Cruz’s poll average in Florida dropped a bit. The category didn’t change (Strong Clinton) but the movement did cause Cruz’s tipping point to go from 6.0% behind Clinton to being 6.4% behind Clinton.
Either way, Cruz continues to be far behind Clinton when you look at things based on state level polls. As I have discussed here before, looking at national polls makes this matchup look much closer. It is unclear at this point if this is exposing an actual divergence between the popular vote and electoral college due to the regional distribution of candidate support, or if it is simply that there haven’t been enough state level polls of this matchup to catch up with recent changes to support levels. If Cruz becomes the Republican nominee, this would eventually become clear.
Of course, looking at the delegate race that doesn’t look too likely right now, so we may never know.
241.8 days until polls start to close.
Note: This post is an update based on the data on ElectionGraphs.com. Election Graphs tracks both a poll based estimate of the Electoral College and a numbers based look at the Delegate Races. All of the charts and graphs seen in this post are from that site. Additional graphs, charts and raw data can be found there. All charts above are clickable to go to the current version of the detail page the chart is from, which may contain more up to date information than the snapshots on this page, which were current as of the time of this post. Follow @ElectionGraphs on Twitter or like Election Graphs on Facebook to see announcements of updates or to join the conversation. For those interested in individual general election poll updates, follow @ElecCollPolls on Twitter for all the polls as they are added.
![]() 1-Click Subscribe in iTunes
1-Click Subscribe in iTunes![]() View Podcast in iTunes
View Podcast in iTunes![]() View Raw Podcast Feed
View Raw Podcast Feed![]() Download MP3 File
Download MP3 File![]() Follow the podcast on Facebook
Follow the podcast on Facebook


