Rubio walked away with 71% of the vote in Puerto Rico. Anything more than 50% meant that he got 100% of Puerto Rico’s 23 delegates.
In addition, some of the TBD delegates in Louisiana were determined since the post about the March 5th results. Rubio picked up 5 delegates while Cruz picked up 1. There are still 5 more delegates TBD from Louisiana. It looks like Louisiana’s rules state these should be officially uncommitted delegates, but the national rules don’t allow that this year, so… we’ll see what happens.
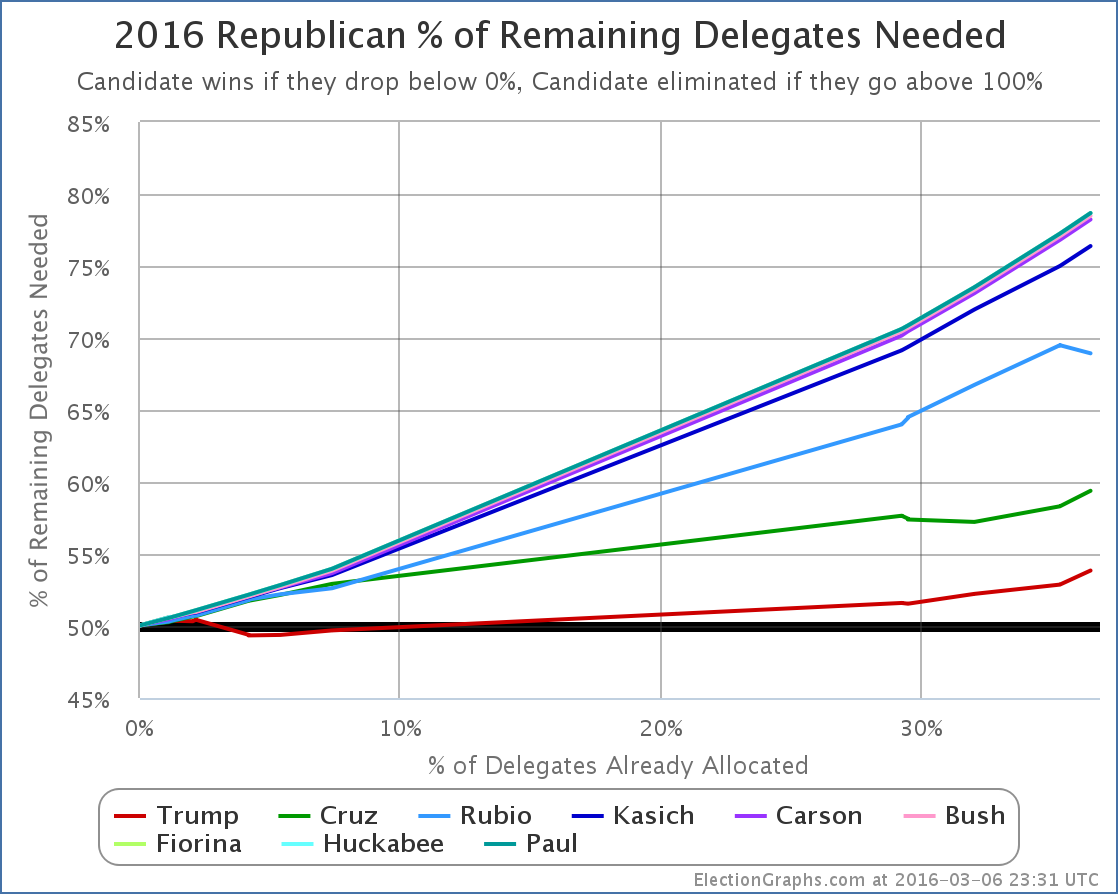
Anyway, that means since the last update, Rubio got 28 of 29 delegates… 96.55%! He had needed only 69.50% to be on track to catch up and win outright!
Uh, of course, nobody expects Rubio to continue at this pace in the next few states.
So lets look at where this puts the “% of remaining delegates needed to win” for the whole field:

You see that dip downward for Rubio? He does actually improve this time around. Now he only needs 68.94% of the remaining delegates to catch up and win! That still seems unlikely given he only has 17.09% of the delegates so far, but at least he went in the right direction for once.
In the mean time, everybody else’s position got worse.
Specifically, Trump moved from needing 52.88% of the remaining delegates to needing 53.85%. For each contest where he fails to reach his needed percentage, the bar for the remaining contests gets higher.
The current delegate totals are: Trump 391, Cruz 304, Rubio 154, Kasich 37… and 15 for people who have dropped out.
Next up on Tuesday for the Republicans are Hawaii, Idaho, Michigan and Mississippi. Lets take a quick look at how they look if we assume today’s RCP poll averages…
Michigan (59 delegates):
- RCP Poll average: 37.3% Trump, 19.8% Cruz, 16.8% Kasich, 15.2% Rubio
- Estimated delegates: 25 Trump, 13 Cruz, 11 Kasich, 10 Rubio
Mississippi (40 delegates):
- Only recent poll: 41% Trump, 17% Cruz, 16% Rubio, 8% Kasich, 5% Carson
- Estimated delegates: 24 Trump, 10 Cruz, 6 Rubio
Idaho (32 delegates):
- No polls, using national average: 35.6% Trump, 19.8% Cruz, 17.4% Rubio, 9.0% Carson, 8.8% Kasich
- Estimated delegates: 32 Trump
Hawaii (19 delegates):
- No polls, using national average: 35.6% Trump, 19.8% Cruz, 17.4% Rubio, 9.0% Carson, 8.8% Kasich
- Estimated delegates: 10 Trump, 5 Cruz, 2 Rubio, 1 Carson, 1 Kasich
Now, Michigan has a bunch of recent polls. Mississippi’s only recent poll is from the last week of February, which isn’t that long ago, but a lot has happened in that week. And I don’t trust using national numbers for Idaho and Hawaii at all really, but that is the best I can do with no polling at all. So where does this get us:
Projected total for March 8th: Trump +91, Cruz +28, Rubio +18, Kasich +12, Carson +1
With these projections, Trump would get 60.67% of the delegates on March 8th. That would be more than the 53.85% of the delegates he would need to improve his position.
The new totals would be: Trump 482, Cruz 332, Rubio 172, Kasich 49… and 16 for people who have dropped out.
Doing the rest of the math, that is a total of 1051 delegates. 1421 delegates would still be available. Trump would need 755 more delegates to win outright, which would be 53.13% of the remaining delegates.
So Trump would have improved his position, but not by very much.
The above assumes that the current polls hold of course. The results this weekend may indicate that Trump has been weakened by the events of the last week. If so, he may significantly underperform these estimates, putting him in a worse position. So these may be estimates that are optimistic for Trump.
And that still keeps us in the contested convention zone. For now.
Trump’s big chance to break out of that won’t come until March 15th with Florida and Ohio’s 165 winner take all delegates.
Until then, watch to see if Trump is able to match his 53.85% target line on Tuesday.
Update 2016-03-09 03:32 UTC – Update to get ready for tonight’s results. New Oklahoma estimates add one delegate for Cruz, subtract one from Trump. This does not significantly change the analysis above.
Note: This post is an update based on the data on ElectionGraphs.com. Election Graphs tracks both a poll based estimate of the Electoral College and a numbers based look at the Delegate Races. All of the charts and graphs seen in this post are from that site. Additional graphs, charts and raw data can be found there. All charts above are clickable to go to the current version of the detail page the chart is from, which may contain more up to date information than the snapshots on this page, which were current as of the time of this post. Follow @ElectionGraphs on Twitter or like Election Graphs on Facebook to see announcements of updates or to join the conversation. For those interested in individual general election poll updates, follow @ElecCollPolls on Twitter for all the polls as they are added.

