We’re still in the phase where the pollsters ask about many candidate combinations. With the most recent polling in Ohio, there is no change in the Clinton vs Trump status, but there were changes to Clinton vs Rubio and Clinton vs Cruz. In both cases, the Republican position improves, and Clinton gets a little weaker.
Clinton vs Trump
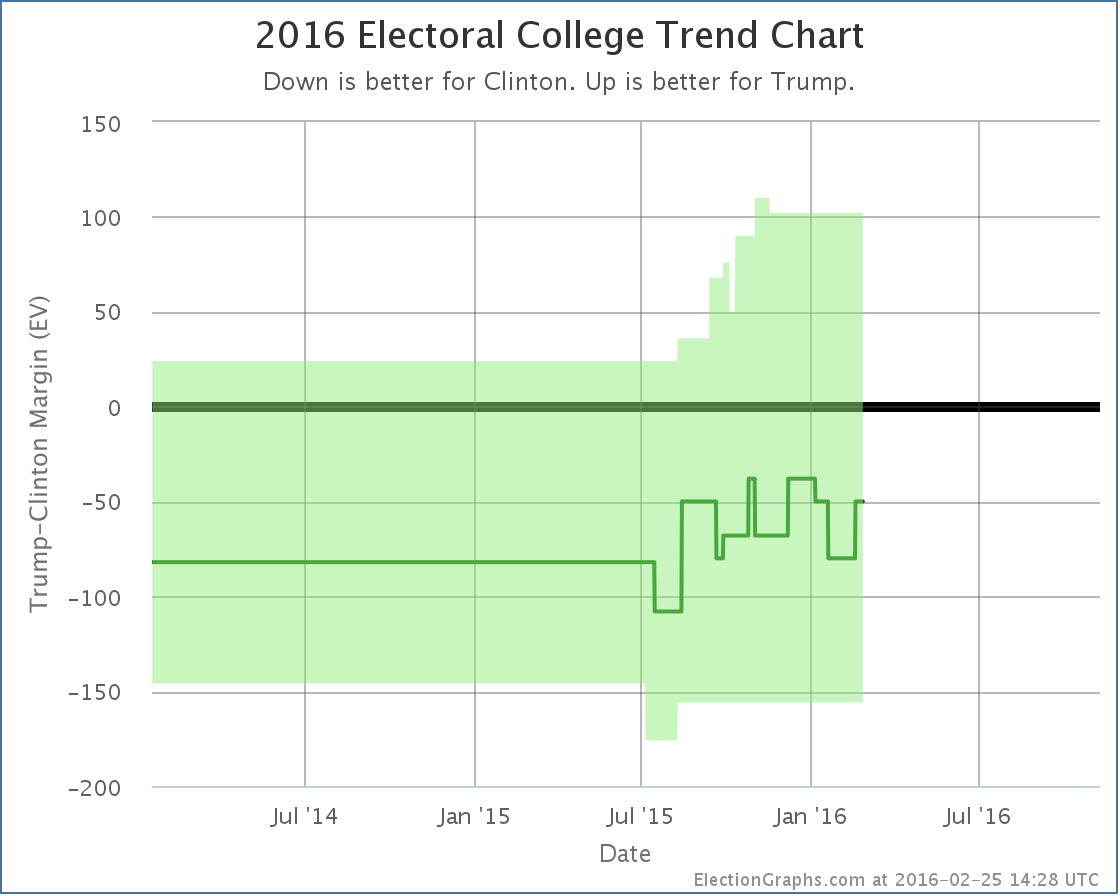
No, this didn’t change, but since these are the two frontrunners, just a quick reminder of where that race stands:
Anything from Clinton winning by 156 electoral votes to Trump winning by 102 electoral votes is plausible given the state polls. Clinton winning by 50 electoral votes is the “expected” result if each candidate wins all the states they are ahead in right now.
Clinton vs Rubio
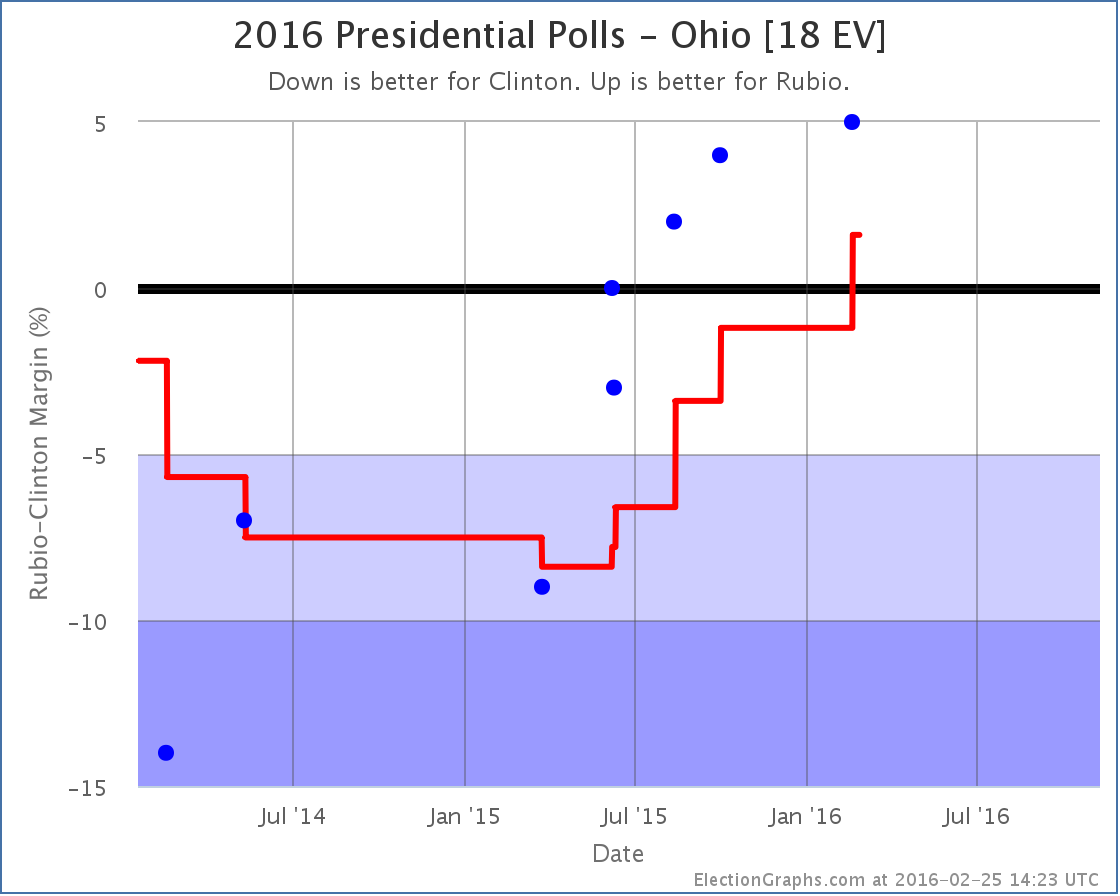
Ohio has been polled less often than one might expect for a state that is traditionally in the “swing state” category, and which looks like it might be again. But the polls for the last year or so have been trending in Rubio’s direction. With this poll, the average pops into the plus side for Rubio. He now leads in Ohio by 1.6% in the average. To be clear, that is still a very close race. But he now has the advantage, so we put Ohio on his side of the ledger.
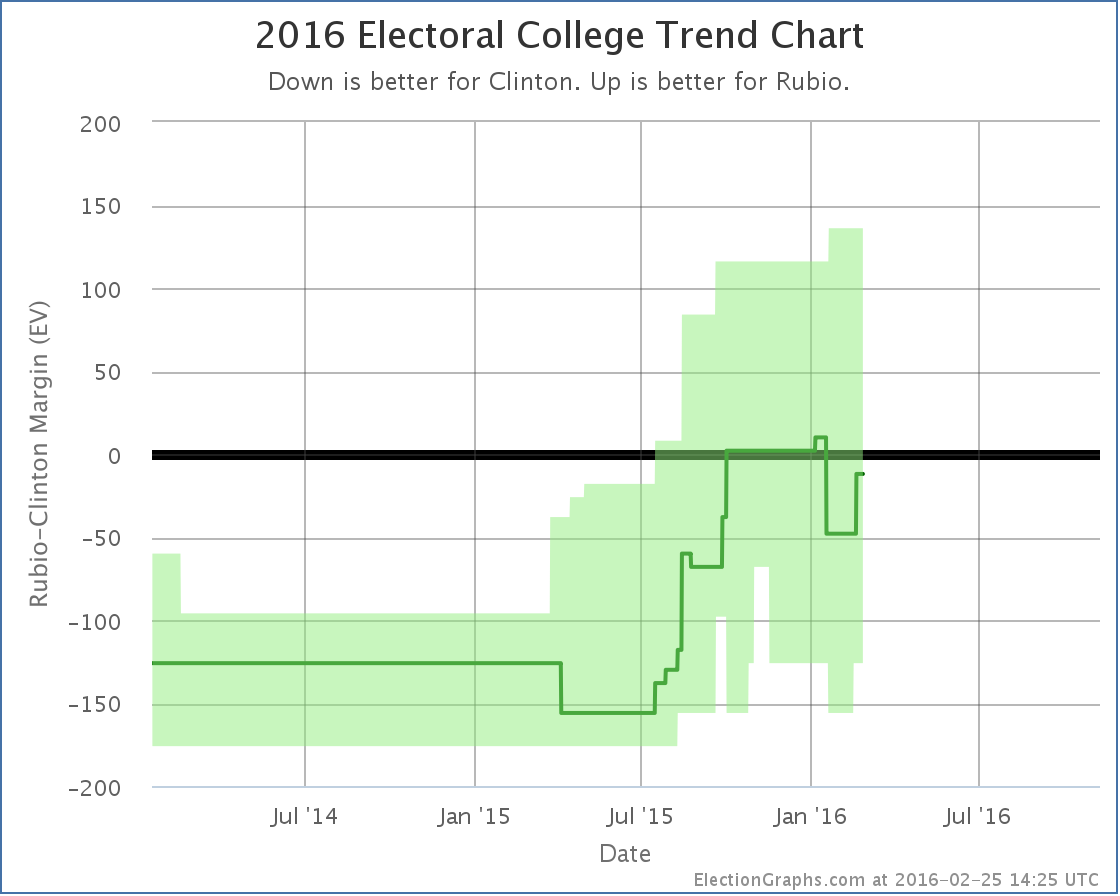
With Ohio back in his column again, if Rubio won every state he is ahead in, and Clinton won every state she is ahead in, Rubio would fall just 12 electoral votes short. He’s not back to leading the race yet, but it is very close. Flipping any one of Florida (0.2% Clinton lead), Virginia (1.2% Clinton lead), Minnesota (1.5% Clinton lead), Michigan (2.9% Clinton lead), or Nevada (4.5% Clinton lead) would do it.
With the large number of close states, anything from Clinton winning by 126 to Rubio winning by 136 would not be surprising though.
Clinton vs Cruz
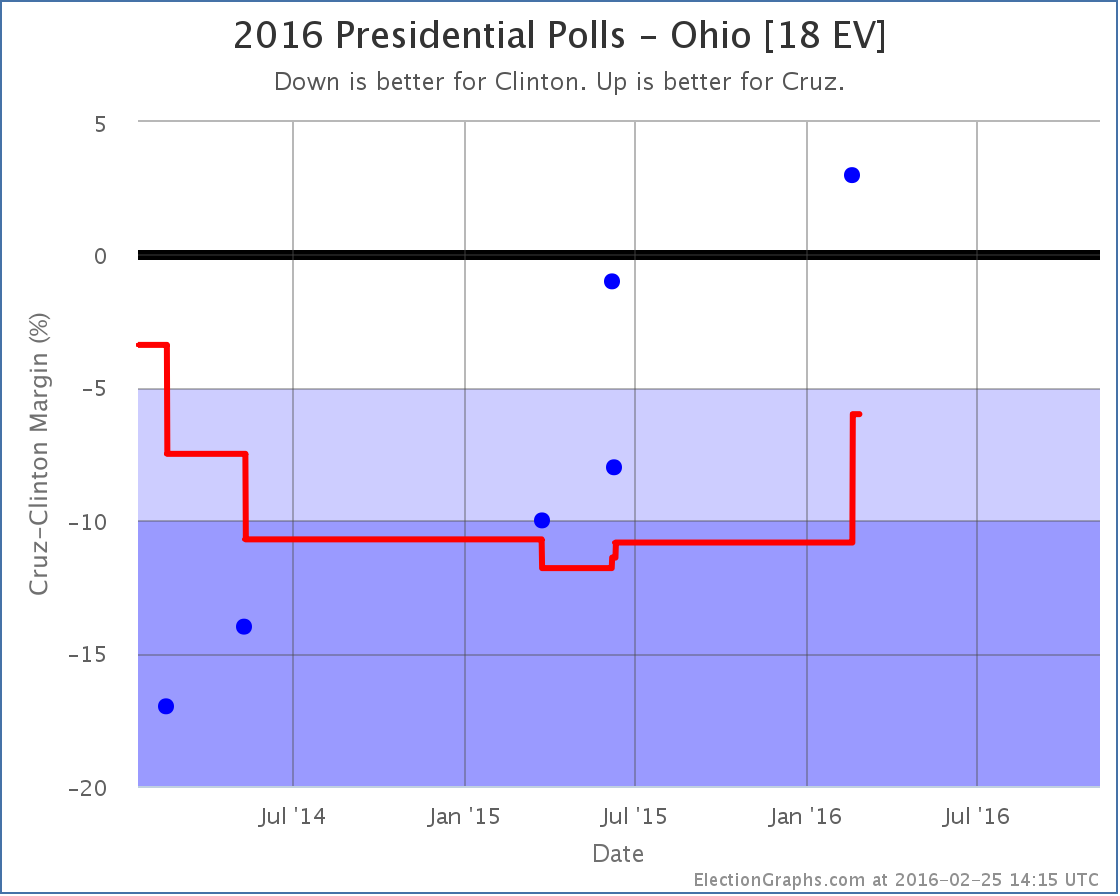
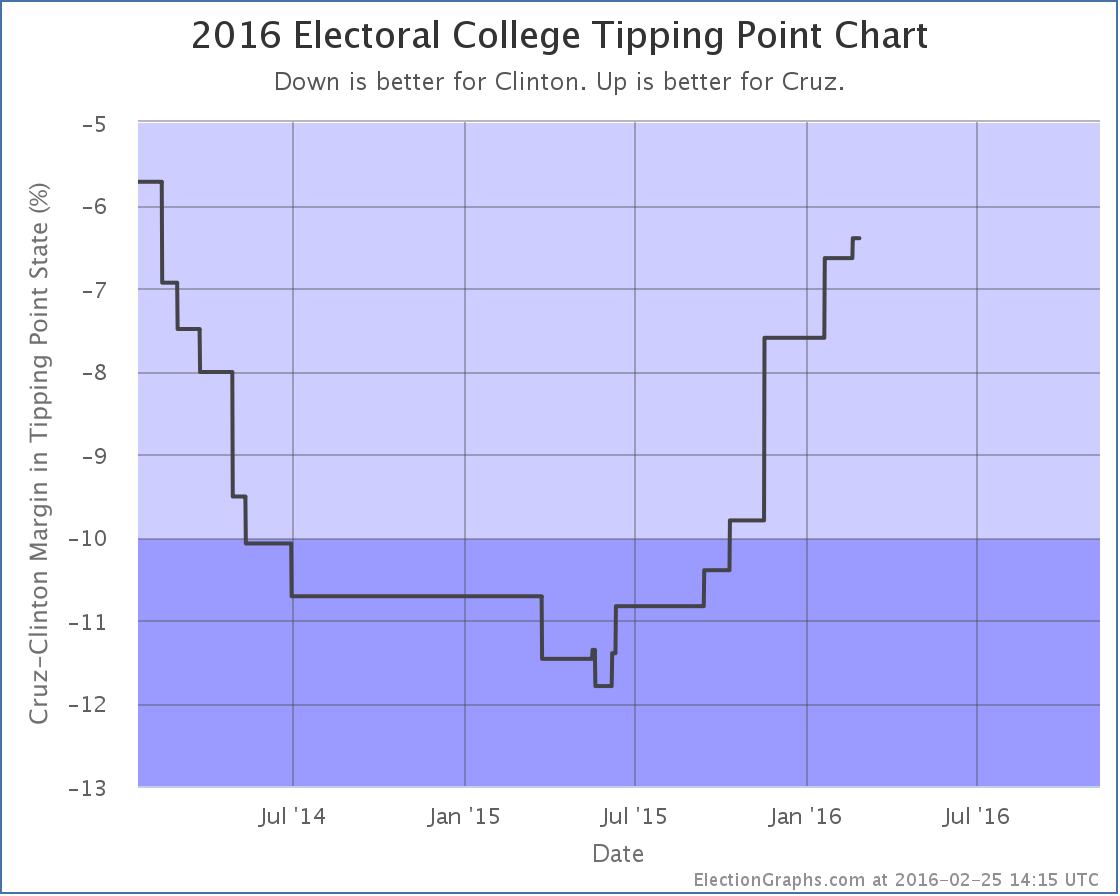
Cruz hasn’t managed to make Ohio competitive against Clinton yet, she still leads him by 6.0% in the poll average, but because with this update Ohio moved past the previous “tipping point state”, the tipping point here moves a bit toward Cruz.
As a reminder, the tipping point is the margin in the state that would put the winning candidate “over the edge” in the electoral college if you order the states by how strongly they support the candidates. Like this:
Prior to this update, the tipping point in Clinton vs Cruz had been Florida, where Clinton led by 6.6%. Now the tipping point is Virginia, where Clinton leads by 6.4%.
The tipping point is essentially like looking at the national popular vote, except it takes into account the structure of the electoral college. It tells you how far the polls would have to move across the board in all states to flip the winner.
Cruz trails Clinton by 6.4% in this metric… but he has slowly but surely been improving his position since last May. It would take a bit more movement before he actually looked competitive with Clinton though.
And that is where things are today.
256.7 days until polls start to close on election night.
Note: This post is an update based on the data on ElectionGraphs.com. Election Graphs tracks both a poll based estimate of the Electoral College and a numbers based look at the Delegate Races. All of the charts and graphs seen in this post are from that site. Additional graphs, charts and raw data can be found there. All charts above are clickable to go to the current version of the detail page the chart is from, which may contain more up to date information than the snapshots on this page, which were current as of the time of this post. Follow @ElectionGraphs on Twitter or like Election Graphs on Facebook to see announcements of updates or to join the conversation. For those interested in individual general election poll updates, follow @ElecCollPolls on Twitter for all the polls as they are added.
