Yesterday’s update was preliminary, and I ended up using the delegate estimates provided by the AP which were used at the New York Times, Washington Post, and other places. My favorite source, Green Papers, had a different set of numbers. When I tried to calculate delegate numbers myself, I came up with yet another set of numbers. I ended up going with the AP numbers.
A little more than a day later and Green Papers updated, now matching what I had calculated myself. So I’m updating the estimates accordingly.
This moves us from:
8 Cruz, 7 Trump, 7 Rubio, 3 Carson, 1 Bush, 1 Paul
to
7 Cruz, 7 Trump, 6 Rubio, 3 Carson, 1 Bush, 1 Fiorina, 1 Kasich, 1 Paul.
The main change here is one less delegate each to Cruz and Rubio, with those delegates picked up at the bottom end by Fiorina and Kasich.
But wait! There is more! The Washington Post and Politico both add two additional delegates. The 27 allocated by the caucus results were already accounted for, so these would be two of the three “party leaders” who end up as automatic delegates. No indication of which party leader did what, but they add one additional delegate each to Cruz and Rubio.
The new Iowa totals become:
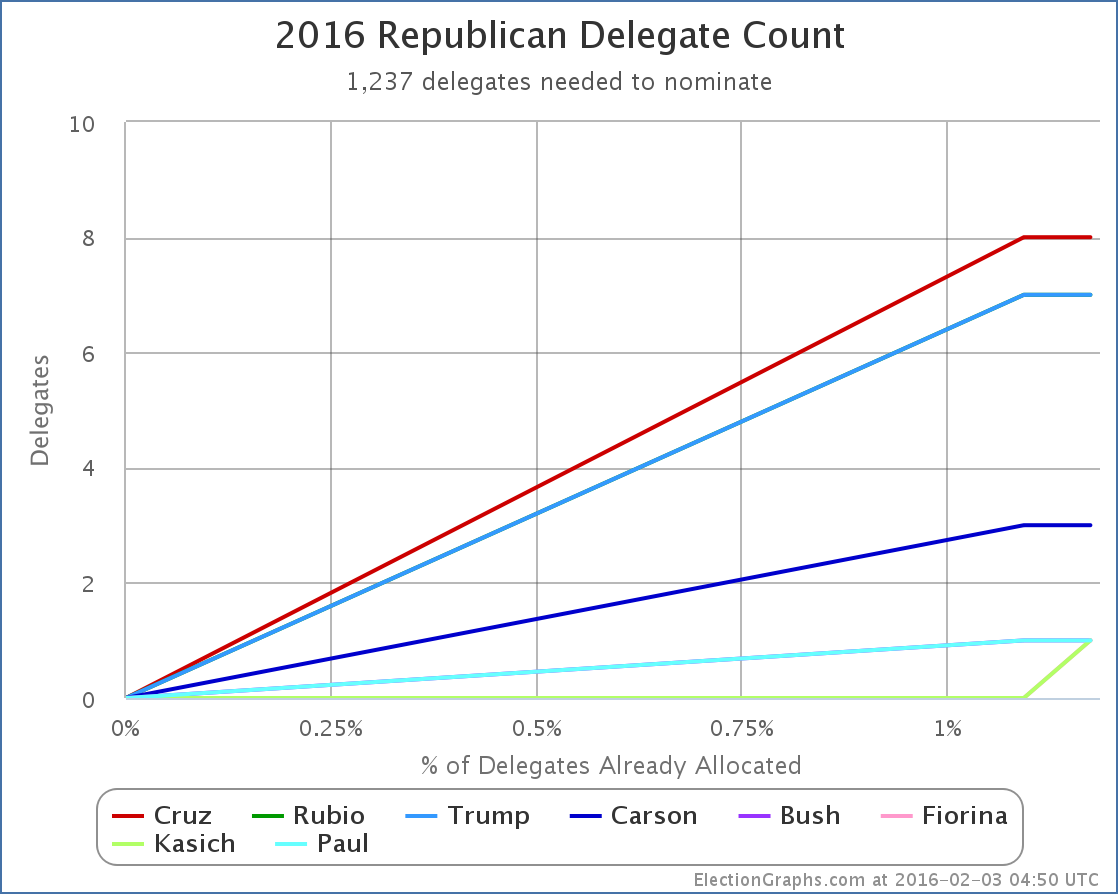
8 Cruz, 7 Rubio, 7 Trump, 3 Carson, 1 Bush, 1 Fiorina, 1 Kasich, 1 Paul.
Between these two changes, the net is simply adding the delegates for Fiorina and Kasich. This means 29 of the 30 Iowa delegates are now accounted for.
Note that even though Paul has “suspended his campaign”, he keeps his delegate unless he explicitly releases it.
The raw delegate count chart now looks like this:
Just a little uptick at the end for Fiorina and Kasich to join Bush and Paul at the 1 delegate mark.
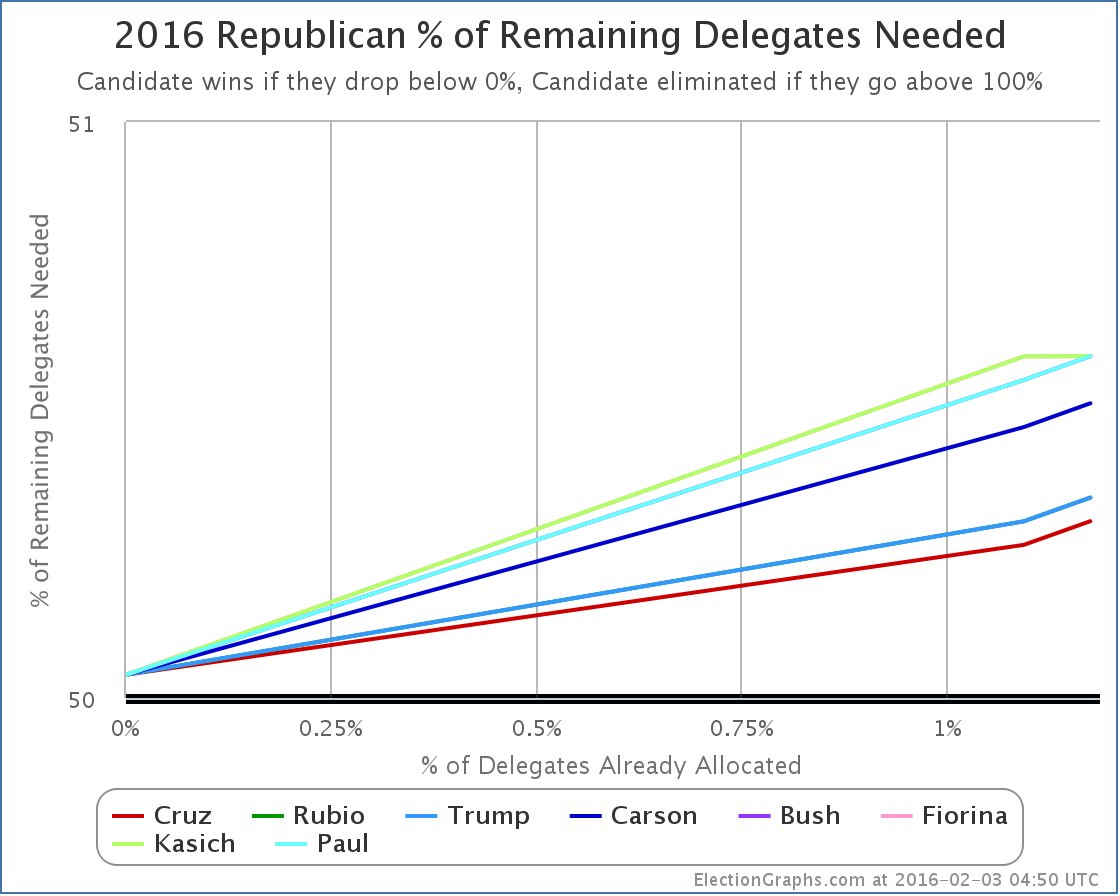
Flipping this over to look at “% of remaining needed to win”:
On this chart, lower is better. When you get down to 0% you win. If you get to 100% you are eliminated. Everybody is still heading upward, not downward, but it is still very early. The whole field here ranges from needing 50.31% of the remaining delegates, to needing 50.59% of the remaining delegates.
Looking specifically at New Hampshire, there are 20 delegates at stake. We are so early, and the % needed numbers so close, that this is easy. The number needed to be on track to win is 11 delegates. Anything less, and the candidate is actually going to be in a harder position in the next contest rather than an easier one.
Let’s game out New Hampshire based on the current RCP averages. Yes, yes, this is based on polling before New Hampshire. Things will change in the next six days. But this is just to model how it works.
The rules via The Green Papers:
- 20 National Convention delegates are to be bound proportionally to presidential contenders based on the primary vote statewide.
- A 10% threshold is required in order for a presidential contender to be allocated National Convention delegates.
- Allocate delegates based on the 20 Г— candidate’s vote Г· total statewide vote. Round to the nearest whole number.
- Any delegate positions that remain open are awarded to the candidate with the highest statewide vote total.
Assume each candidate gets exactly their poll average today. Only the candidates over 10% matter, so with RCP as of right now that is:
33.4% Trump, 12.2% Cruz, 10.8% Rubio, 10.4% Kasich
Converting this to delegates with the rounding rules above, you get:
7 Trump, 2 Cruz, 2 Kasich, 2 Rubio
This is only 13, so there are 7 delegates left. According to the last rule, these all go to the leader, so we end up with:
14 Trump, 2 Cruz, 2 Kasich, 2 Rubio
And therefore Trump would get 70% of the delegates despite only getting 33.7% of the vote. Trump’s line on the “% needed to win” would go down, while everybody else would go up.
After this hypothetical New Hampshire result, the overall race would be:
21 Trump, 10 Cruz, 9 Rubio, 3 Carson, 3 Kasich, 1 Bush, 1 Paul, 1 Fiorina.
Trump would still only have 42.9% of the delegates, which is not a majority, but Cruz would be way back at 20.4% and you’d have Trump starting to pull away from the pack. Still only 1.98% of delegates allocated at that point though, with lots of room for further changes.
The RCP average on February 3rd is NOT going to look like the actual results on Primary night. This is just an example.
The points to take away:
- The detailed delegate rules matter, you don’t necessarily have to win a popular vote majority to win a delegate majority.
- We’re still so very early, one contest can have a major effect on the delegate totals, and each state is very different, so don’t put much stock in extrapolating Iowa to future contests.
Of course New Hampshire will be here soon enough, and we’ll do this with the real results.
Note: This post is an update based on the data on ElectionGraphs.com. Election Graphs tracks both a poll based estimate of the Electoral College and a numbers based look at the Delegate Races. All of the charts and graphs seen in this post are from that site. Additional graphs, charts and raw data can be found there. All charts above are clickable to go to the current version of the detail page the chart is from, which may contain more up to date information than the snapshots on this page, which were current as of the time of this post. Follow @ElectionGraphs on Twitter or like Election Graphs on Facebook to see announcements of updates or to join the conversation. For those interested in individual general election poll updates, follow @ElecCollPolls on Twitter for all the polls as they are added.

