My primary race delegate tracking for both parties will be out very soon… promise. In the mean time, rather than just looking at the delegate leaders on each side against each other, we continue to concentrate on the five best polled candidate combinations.
With a batch of new polls added in North Carolina, Florida, and New Hampshire, it starts to look like the long trend of Clinton getting weaker and weaker against a wide variety of Republican rivals may have ended. Maybe. For now. A little bit. Things will change before we are done. Polls like these aren’t predictive of the general election until after the conventions. Caveat caveat caveat.
Lets look at each category change by state:
Florida (29 EV)
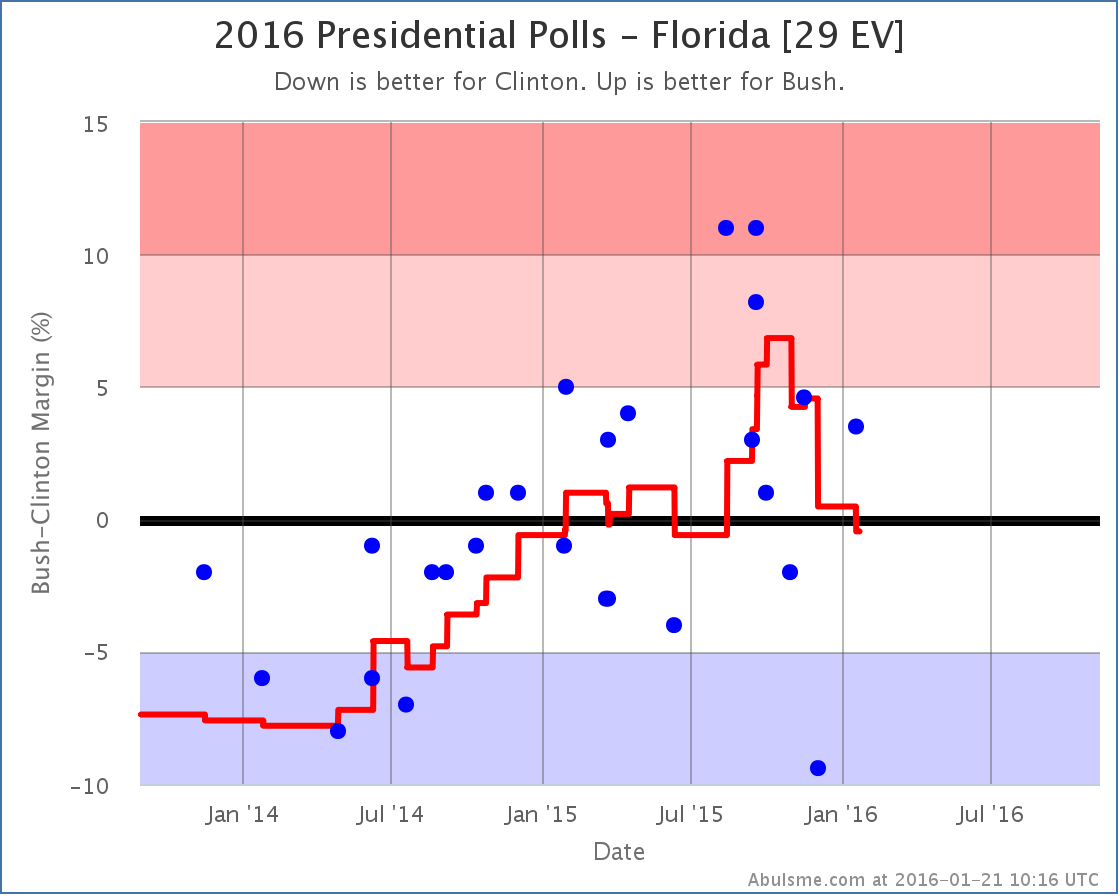
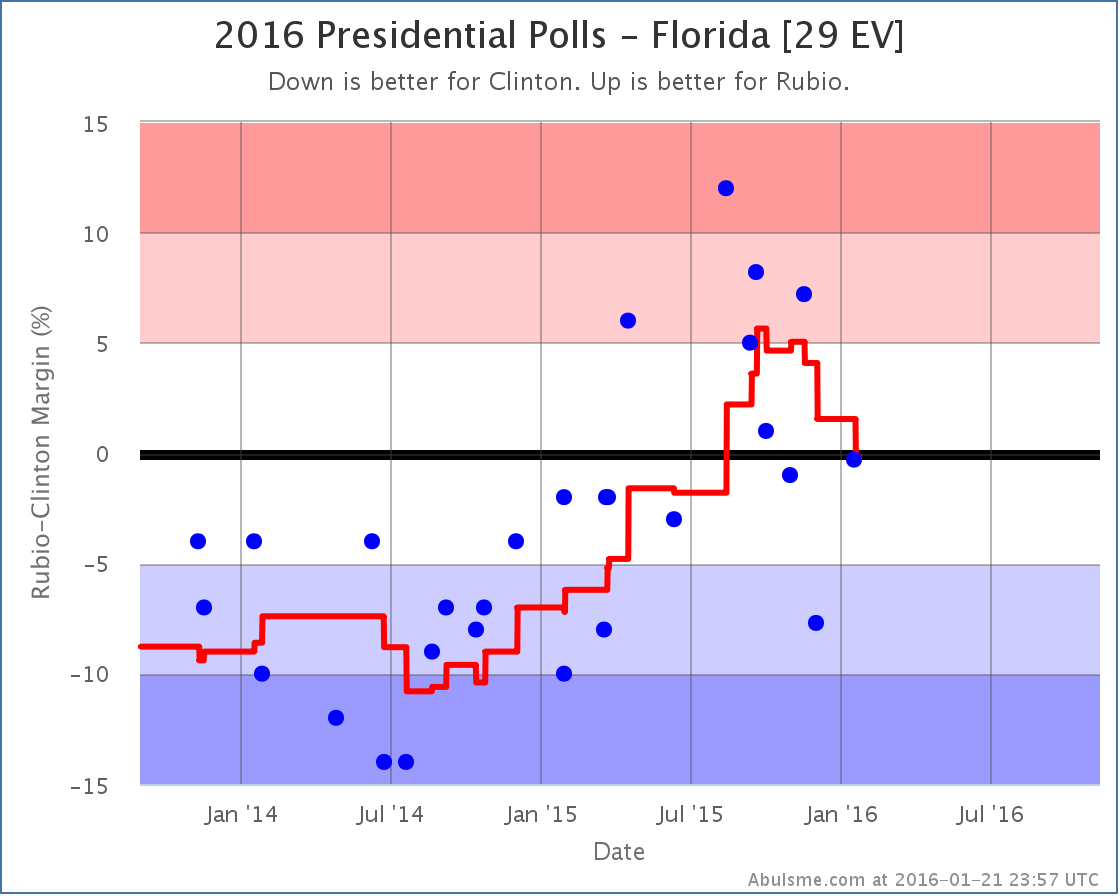
Of the best five polled candidate combinations, two Republicans have their positions deteriorate against Clinton in this update, Bush and Rubio:
Both candidates seemed to peak in late September or early October, and since then have been weakening. With the latest set of poll updates, both states move from being weakly on the Republican side of the line, to being Weak Clinton. The “weak” here should be emphasized. Clinton’s lead over Bush in the average is only 0.5%, and over Rubio it is only 0.2%. This is about as close as you can get. Since for the analysis here any lead under 5% is considered as one that could easily disappear overnight, at these even smaller margins, this is essentially a tie. But for the last few months, the movement has been in Clinton’s direction.
North Carolina (15 EV)
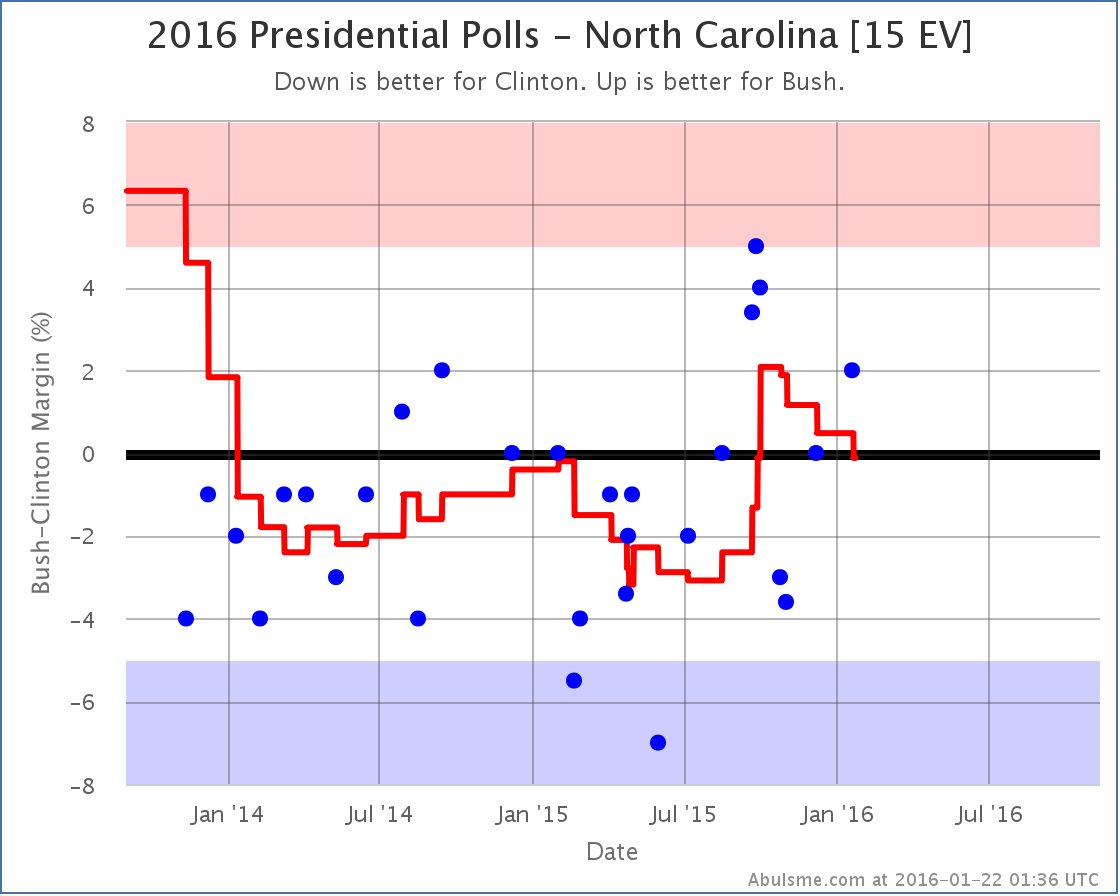
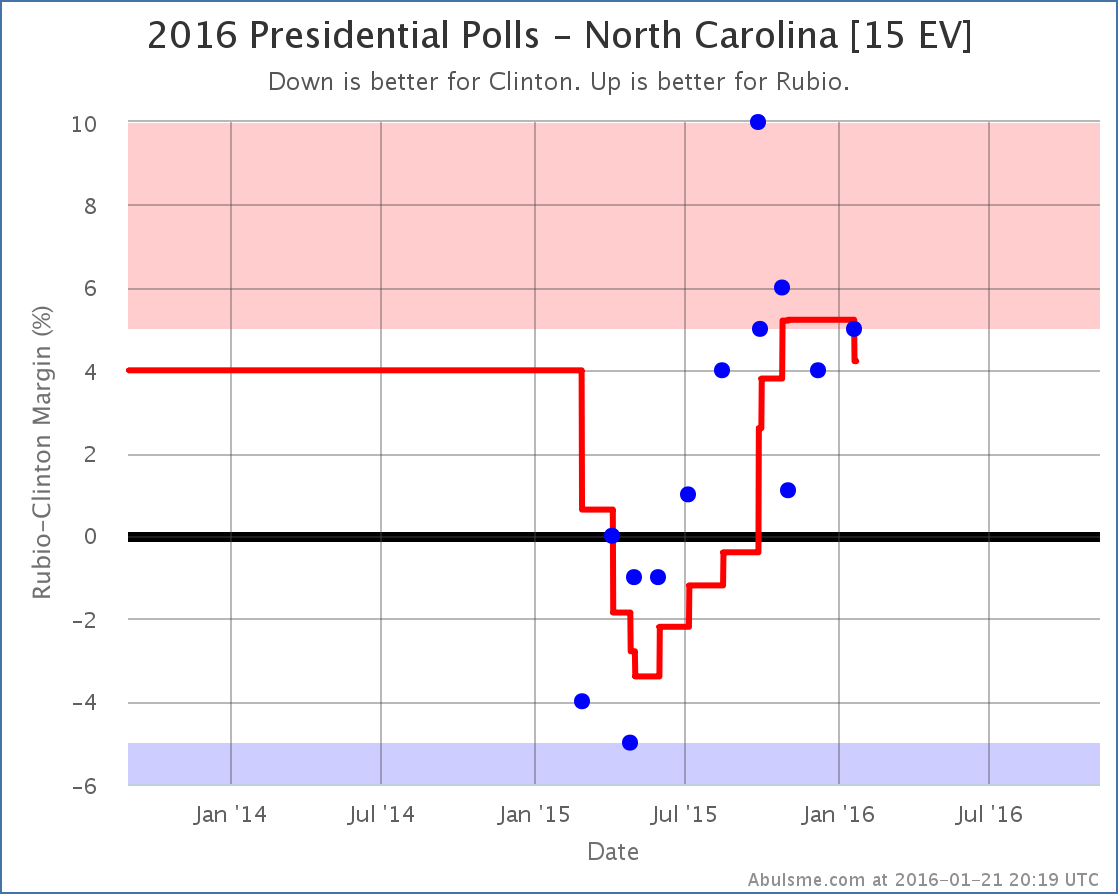
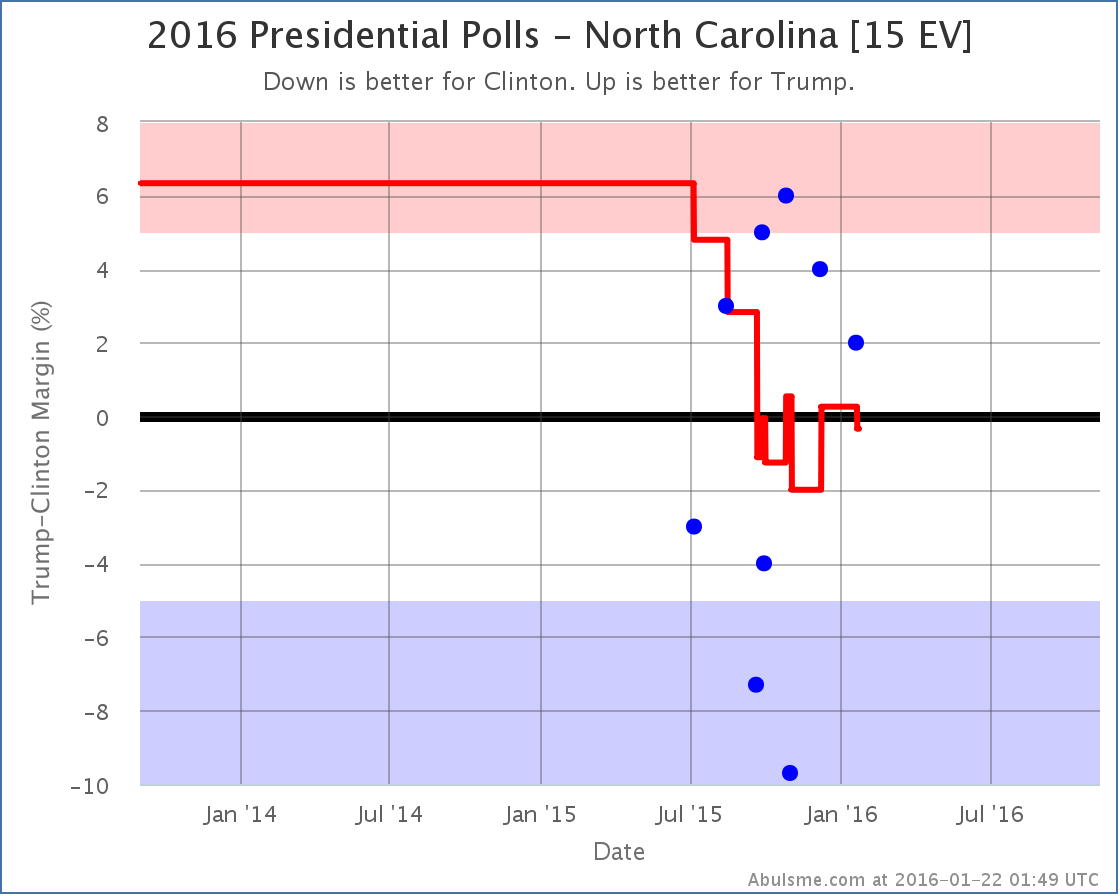
In North Carolina, once again Bush and Rubio lose ground to Clinton. Although technically with the current update Clinton vs Trump dropped to the 6th best polled candidate combination, I know the Trumpets will want to hear about how he is doing, so I’ll mention that Trump also weakens in North Carolina. Yes, yes, I know that any such indications are just propaganda from the vast establishment conspiracy of which I am a part. But anyway… looking at the charts:
In this case the averages for Bush and Trump against Clinton move from Weak Republican to Weak Clinton, but once again the “weak” is the key here. Clinton leads Bush by 0.1% and Trump by 0.3%. So again, super close. A move from just barely on one side of the line to just barely on the other side of the line isn’t really too meaningful except if it seems part of a larger movement. In the case of Bush, the average seems to have been moving toward Clinton for several months. In the case of Trump, it is more bouncing around in a range over the past few months.
Rubio does a bit better here. North Carolina had actually been in the “Strong Rubio” category for a few months, with the poll average showing a Rubio lead of over 5%. With the latest update, Rubio’s lead slips under 5% to 4.2%, which means I once again consider North Carolina a state that could go either way in this matchup, but Rubio still has a lead.
New Hampshire [4 EV]
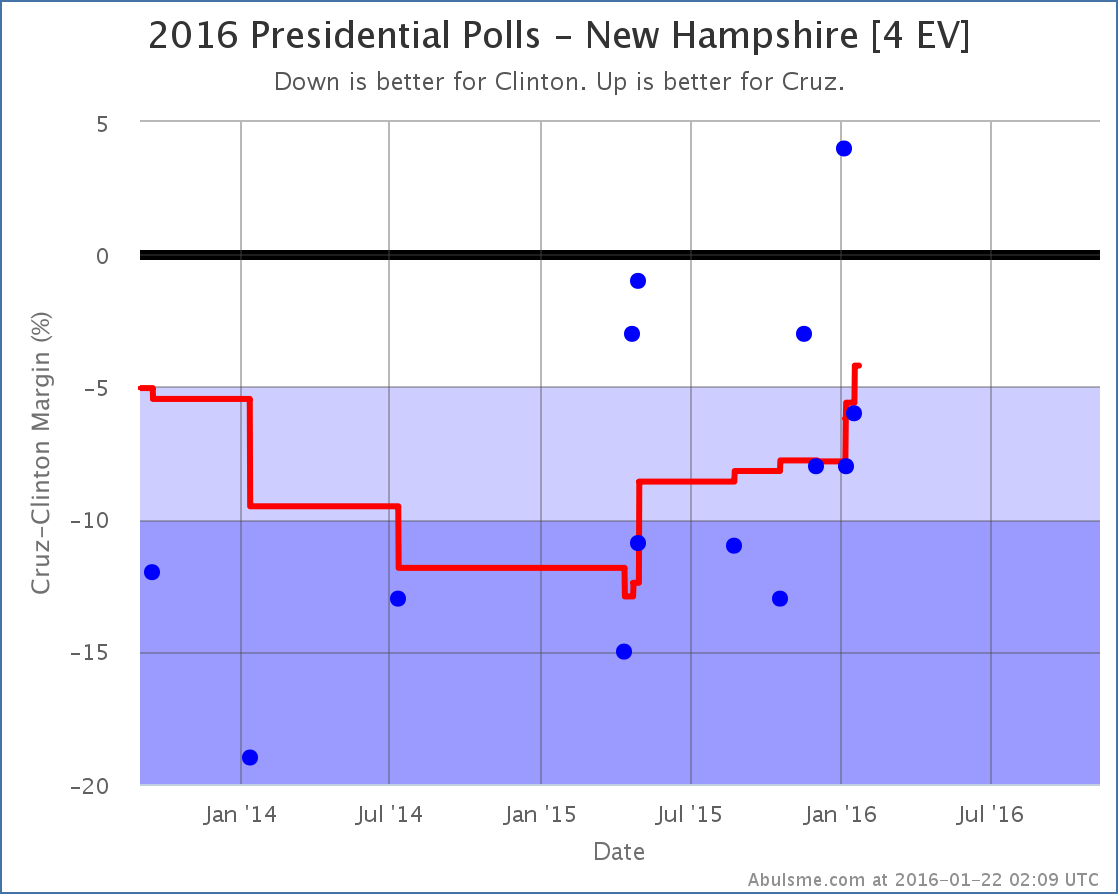
New Hampshire is the one state that has good news for the Republicans in this update. No category changes for Bush, Rubio, or Trump… but this time Cruz jumps into a new category.
Cruz’s recent movement in New Hampshire is the opposite of the trends we were looking at for the other candidates in the other states. Cruz is gaining on Clinton in New Hampshire. For the first time, the state starts to look competitive in this match up. Clinton is still up 4.2% in the average, but now it is conceivably within reach for Cruz.
National Ranges
So with all these various changes, what do things look like nationally for all these candidate pairs? Here we go:
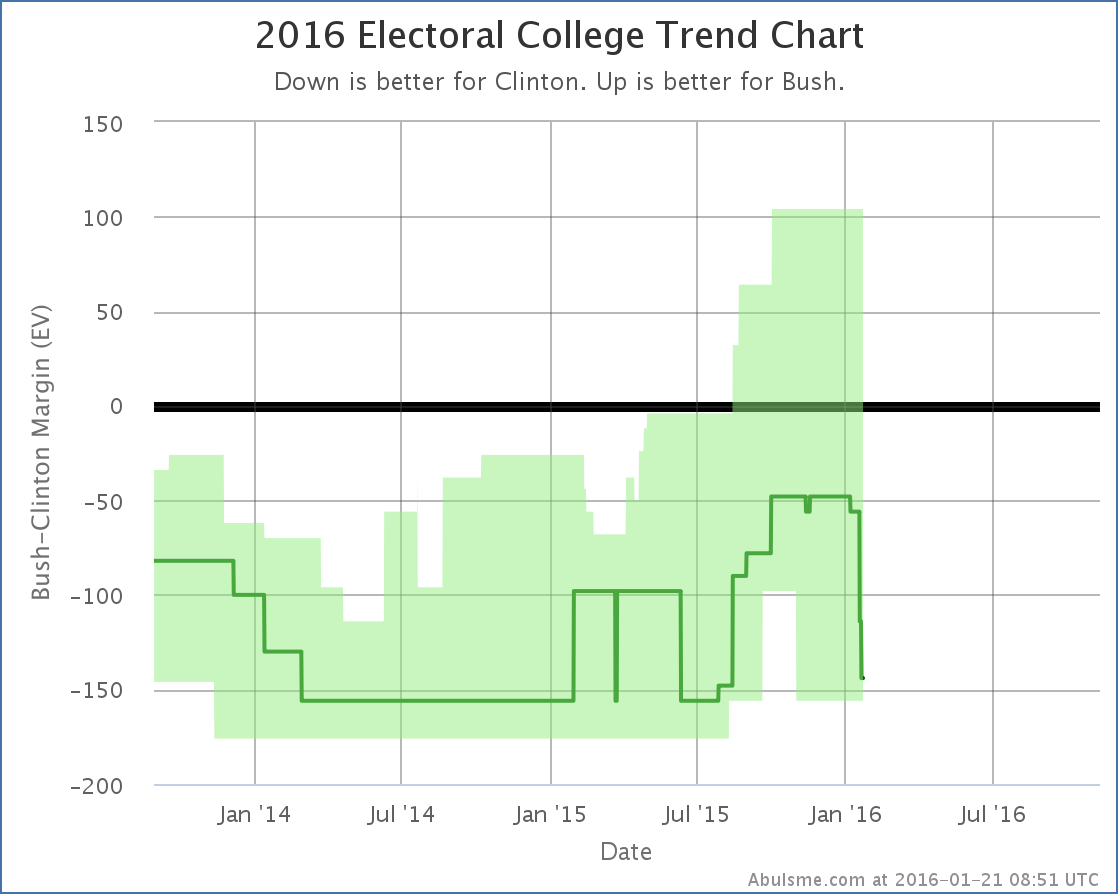
With Florida and North Carolina back out of his column, the result if everybody just wins the states they are ahead in now sits at Bush losing by 144 electoral votes. If he manages to flip the states where Clinton is ahead by less than 5% he could still win by up to 104 electoral votes though, so while Bush is behind, this is still a race.
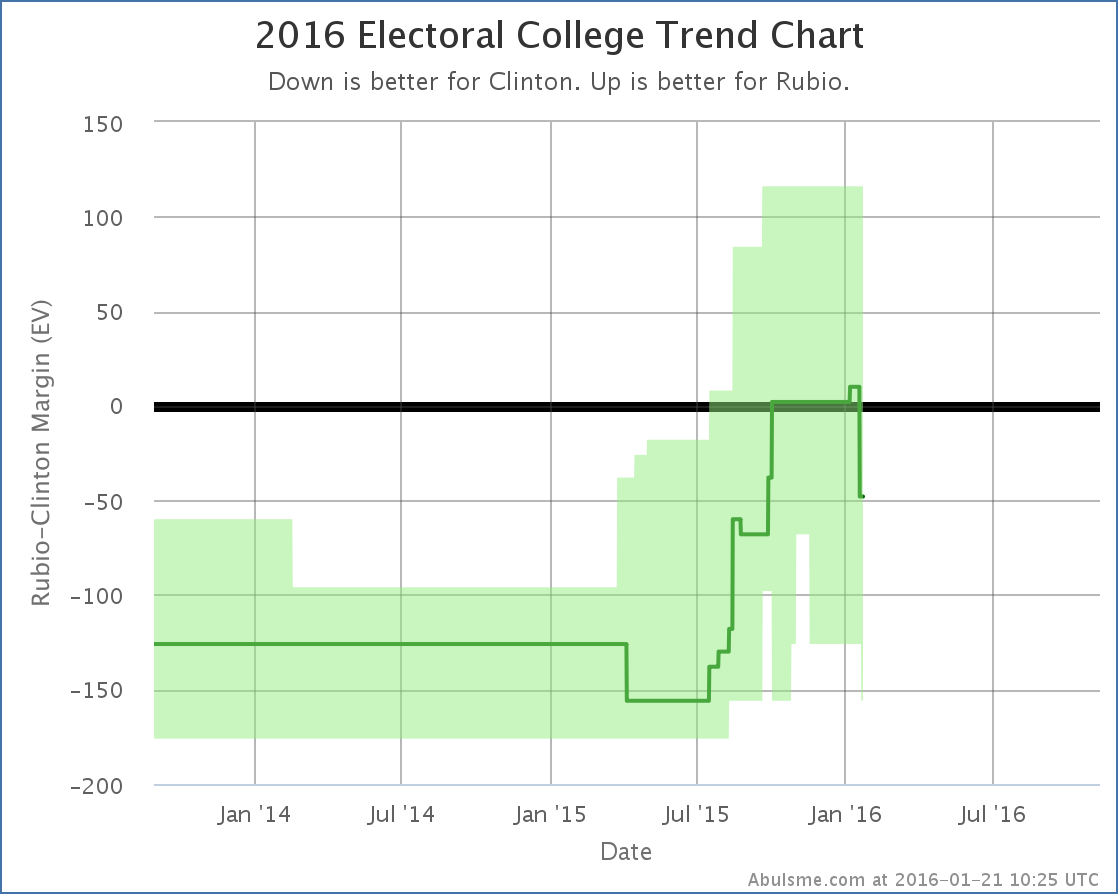
Before this update, Clinton vs Rubio was actually expected to be a narrow 10 electoral vote Rubio win. But if you take Florida away, that changes into a 48 electoral vote loss. With North Carolina also now considered a possibility for Clinton, Clinton’s “best case” improves to a 156 electoral vote win. Rubio’s best case is still a 116 electoral vote win though, so this matchup is also a real race that could go either way.
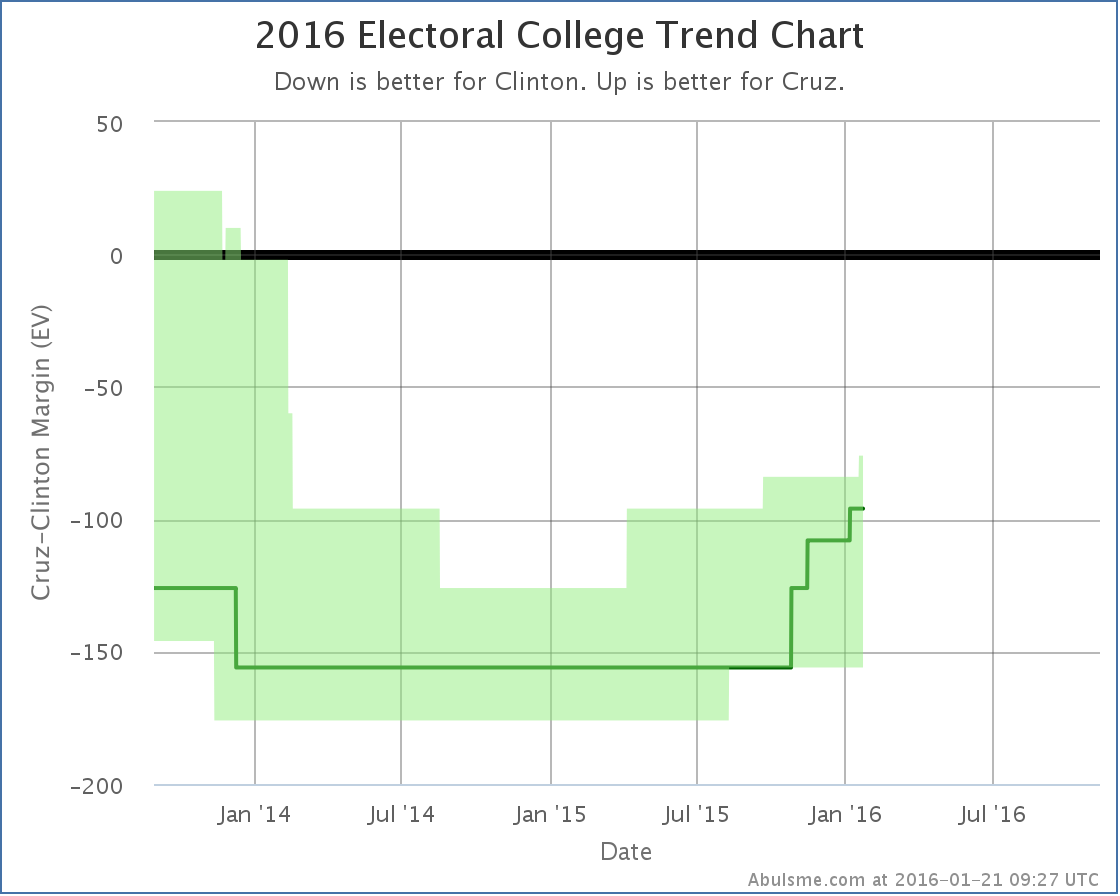
On the other hand… making New Hampshire possible brings Cruz’s best case… where he wins every state he is ahead in, plus all the states where Clinton’s lead is less than 5%… to Cruz losing by 76 electoral votes. This is better than it was. Cruz has been improving since last spring. But he is still not yet in a place that would make a Clinton vs Cruz race even competitive. Right now that matchup looks like an easy Clinton win.
Now, the Real Clear Politics average for Clinton vs Cruz actually shows Cruz ahead of Clinton right now. (Rubio too.) How does this mesh? First thing to note is that the state level polling that the estimates on this site are based on are still not happening quickly enough to show national movement that happens on timeframes less than a few months. So it is quite possible there has been a recent move just isn’t reflected in the state numbers yet. If so, if Cruz ends up the nominee, there will be a lot more polling, and we’ll see the state level analysis move toward the national numbers as more data becomes available. It is of course also possible that Cruz’s support is distributed between states in such a way that gives him a popular vote advantage while still leaving him behind in the electoral college. To be frank though, that is less likely.
Given that, it is reasonable to think that perhaps the gains Cruz showed in the New Hampshire update today are quite likely happening in other states as well, there just isn’t the polling available yet to show it on a state by state basis. So Cruz may be stronger than he appears on this chart.
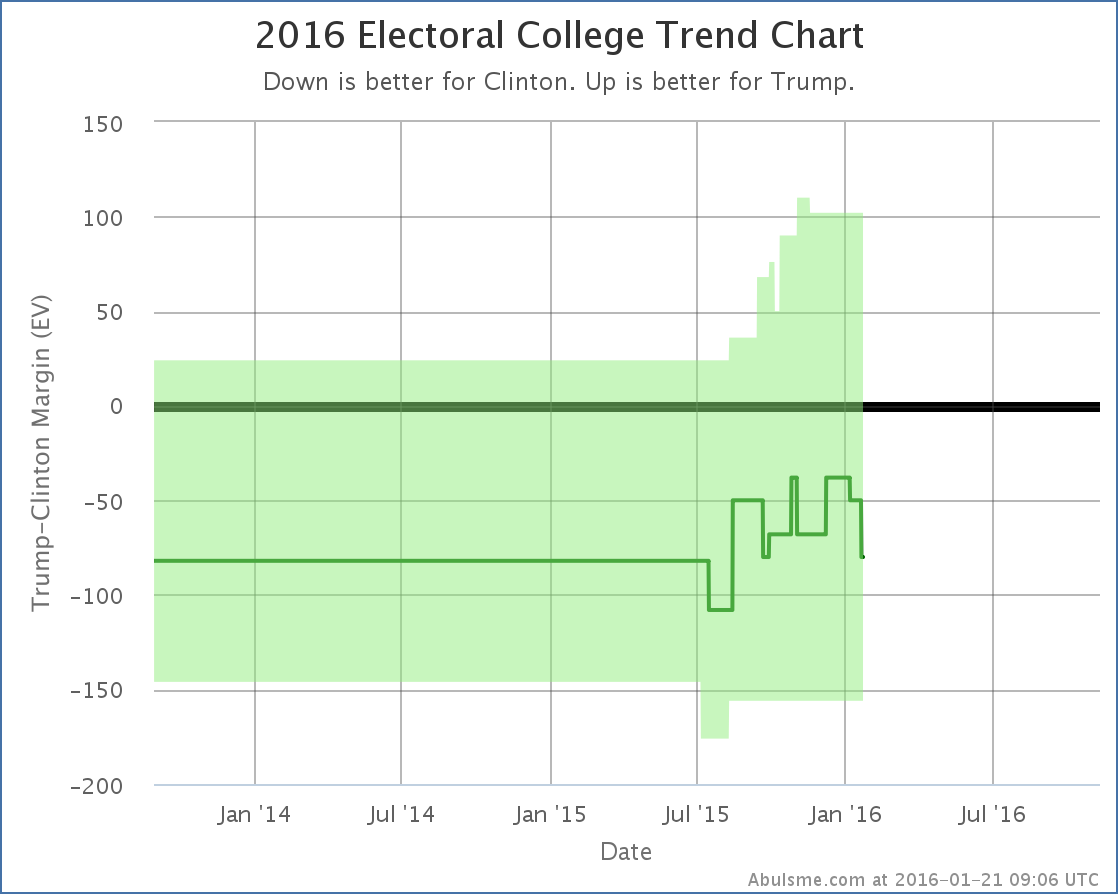
There really wasn’t polling on Trump before this summer, so most if not all of the movement seen here is not real movement, but just the process of getting enough polls to have a reasonable picture of how Trump is doing. The “expected” case doesn’t show a real trend, it has just bounced around a bit. Trump’s best case kept improving as more polls became available. At the moment, the state poll averages show a Clinton vs Trump race could reasonably be anywhere from a 156 electoral vote Clinton win to a 102 electoral vote Trump win, with the “expected case” being an 80 electoral vote win by Clinton. But this matchup DOES look like a real race, not a Clinton rout. Trump does better against Clinton than either Cruz or Bush. Of these four, only Rubio does better.
Or course, I should repeat all the usual caveats again. See the top of this post. There is still lots of time. Everything can and will change over the next few months.
291.9 days until the polls start to close. 11 days until the Iowa caucuses.
This whole thing is going to start moving very quickly very soon.
PS for Sanders fans: Although no match up vs Sanders has been polled enough to talk about in detail here, with today’s updates Sanders strengthened vs Rubio in North Carolina, while weakening against both Rubio and Cruz in Florida.
Note: This post is an update based on the data on ElectionGraphs.com. All of the charts and graphs seen here are from that site. Graphs, charts and raw data can be found there for the race nationally and in each state for every candidate combination that has been polled at the state level. In addition, comparisons of the best polled candidate combinations both nationally and each in each state are available. All charts above are clickable to go to the current version of the detail page the chart is from, which may contain more up to date information than the snapshots on this page, which were current as of the time of this post. Follow @ElecCollPolls on Twitter for specific poll details as I add them. And like Election Graphs on Facebook!
[Blog Post] Electoral College: Did Clinton already bottom against the Republican field? https://t.co/xVDlgJbrtv