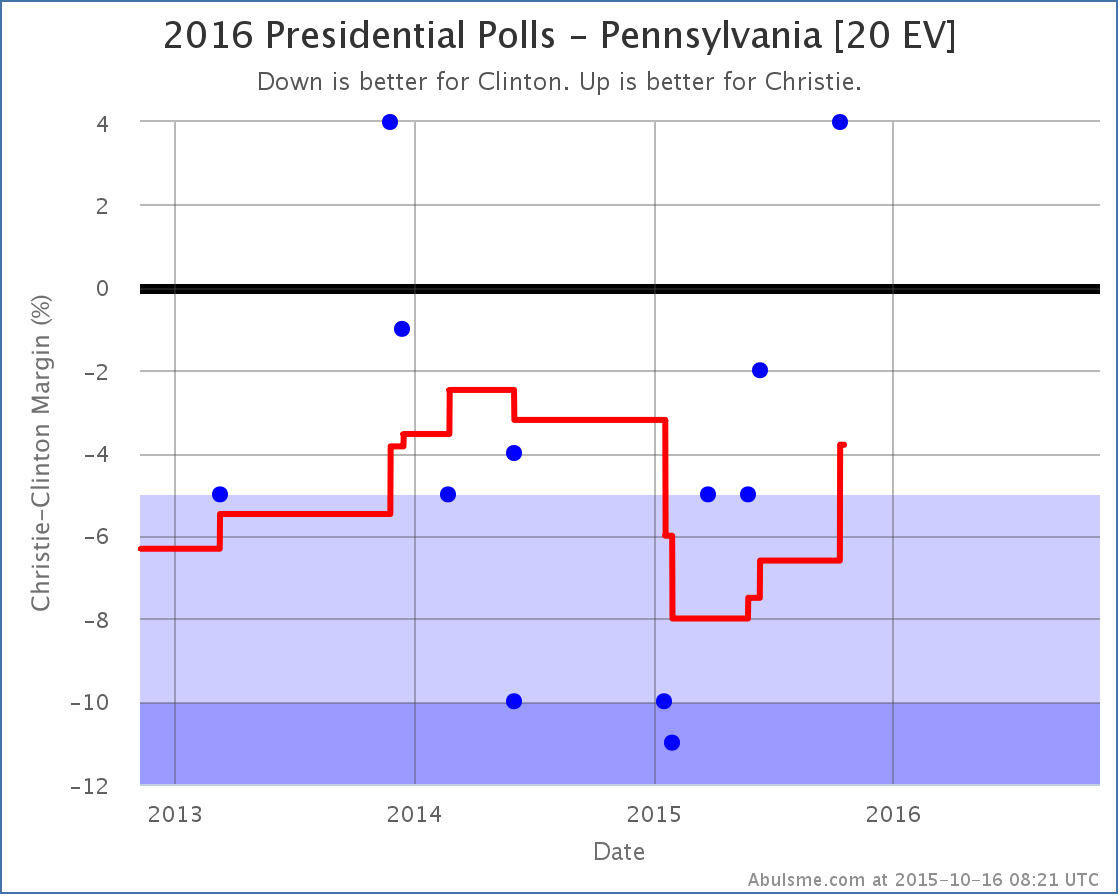
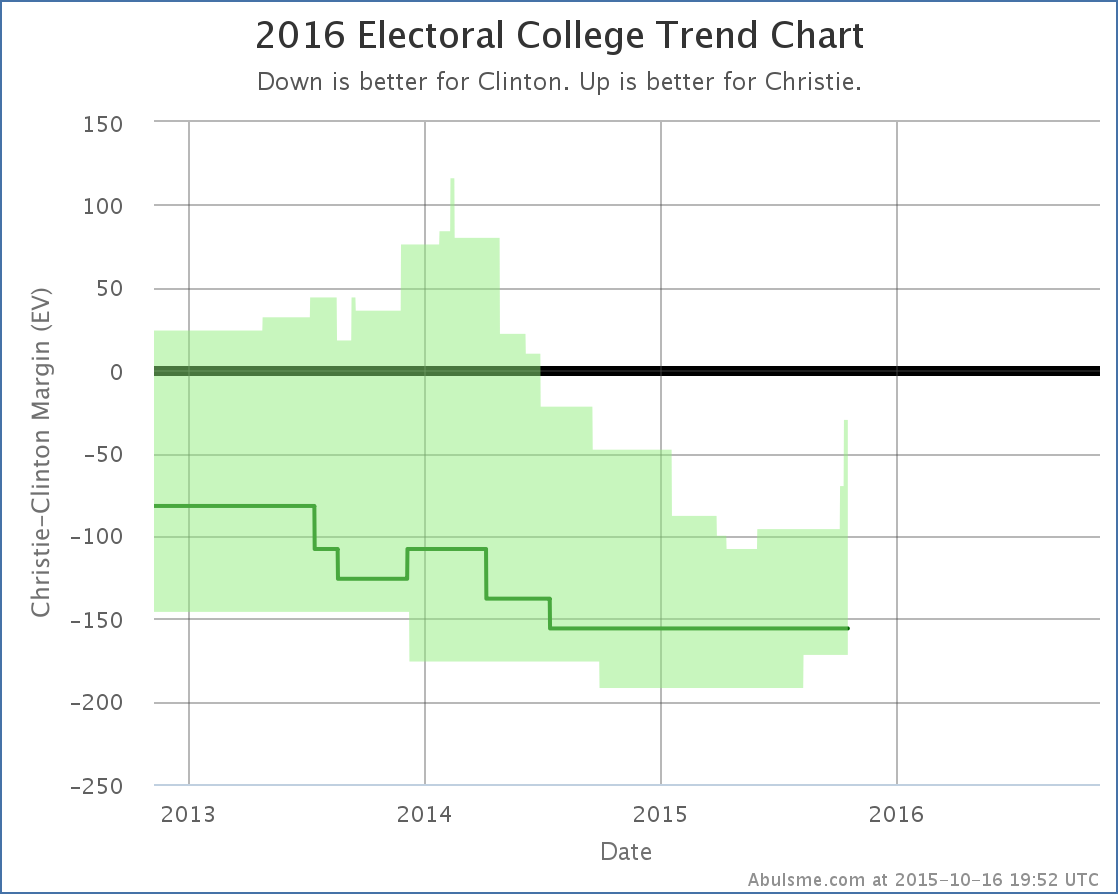
As I mentioned yesterday, Christie is seemingly still in the Republican race. There hadn’t been any state level polls that included him since August, but then yesterday there was one in Virginia that improved his position against Clinton. And now in today’s update we have another poll that included him, this time PPP in Pennsylvania, and once again the result is an improvement in Christie’s position vs Clinton.
This makes Pennsylvania a possible pickup for Christie and thus improves his “best case” scenario even further.
I snarked yesterday about how Christie’s best case was to lose by 70 electoral votes. Well, now his best case is to lose by 30 electoral votes. So he actually is getting a lot closer to being in reach. Of course I also made fun of his 1.9% in the RCP average of national Republican polls… oops, it is 1.7% now.
Clinton vs Christie is still the 5th “best polled” candidate combination according to the metric I use, but I expect that will probably change before too long as we continue to get more and more polls including Trump, Carson, Fiorina and Cruz, with fewer including Christie. Not to mention more with Sanders and Biden. They all seem to have gotten more polling action lately, but not yet enough to bring them into the “top five” I talk about here. There are still significant gaps in close state polling for those candidates, but those are gradually being filled in.
To briefly illustrate why I don’t talk about all the candidate combinations here, the new polling in Pennsylvania from PPP yesterday actually resulted in all of these changes:
-
2015-10-16 08:27:39 – Biden vs Fiorina state category change: PA has moved from Weak Biden to Strong Biden http://electiongraphs.com/2016ec/polldata.php?Dem=Biden&Rep=Fiorina&State=PA&ts=1444984059
- 2015-10-16 08:36:21 – Fiorina best case vs Biden has changed: Biden 237 to Fiorina 301 -> Biden 257 to Fiorina 281 http://electiongraphs.com/2016ec/?Dem=Biden&Rep=Fiorina&ts=1444984581
-
2015-10-16 07:54:15 – Clinton vs Carson state category change: PA has moved from Strong Clinton to Weak Clinton http://electiongraphs.com/2016ec/polldata.php?Dem=Clinton&Rep=Carson&State=PA&ts=1444982055
-
2015-10-16 08:12:55 – Carson best case vs Clinton has changed: Clinton 251 to Carson 287 -> Clinton 231 to Carson 307 http://electiongraphs.com/2016ec/?Dem=Clinton&Rep=Carson&ts=1444983175
-
2015-10-16 08:12:29 – Clinton vs Christie state category change: PA has moved from Strong Clinton to Weak Clinton http://electiongraphs.com/2016ec/polldata.php?Dem=Clinton&Rep=Christie&State=PA&ts=1444983149
- 2015-10-16 08:31:59 – Christie best case vs Clinton has changed: Clinton 304 to Christie 234 -> Clinton 284 to Christie 254 http://electiongraphs.com/2016ec/?Dem=Clinton&Rep=Christie&ts=1444984319
-
2015-10-16 08:17:27 – Clinton vs Cruz state category change: PA has moved from Solid Clinton to Strong Clinton http://electiongraphs.com/2016ec/polldata.php?Dem=Clinton&Rep=Cruz&State=PA&ts=1444983447
- 2015-10-16 08:45:01 – Clinton vs Cruz tipping point change: Clinton by 10.4 in FL -> Clinton by 9.8 in PA http://electiongraphs.com/2016ec/?Dem=Clinton&Rep=Cruz&ts=1444985101
- 2015-10-16 09:13:07 – Clinton vs Trump state category change: PA has moved from Strong Clinton to Weak Clinton http://electiongraphs.com/2016ec/polldata.php?Dem=Clinton&Rep=Trump&State=PA&ts=1444986787
- 2015-10-16 09:42:38 – Trump best case vs Clinton has changed: Clinton 244 to Trump 294 -> Clinton 224 to Trump 314 http://electiongraphs.com/2016ec/?Dem=Clinton&Rep=Trump&ts=1444988558
-
2015-10-16 08:37:37 – Clinton vs Huckabee state category change: PA has moved from Solid Clinton to Strong Clinton http://electiongraphs.com/2016ec/polldata.php?Dem=Clinton&Rep=Huckabee&State=PA&ts=1444984657
-
2015-10-16 09:01:55 – Sanders vs Rubio state category change: PA has moved from Weak Sanders to Weak Rubio http://electiongraphs.com/2016ec/polldata.php?Dem=Sanders&Rep=Rubio&State=PA&ts=1444986115
- 2015-10-16 09:46:44 – Sanders vs Rubio tipping point change: Sanders by 0 in PA -> Rubio by 0.7 in PA http://electiongraphs.com/2016ec/?Dem=Sanders&Rep=Rubio&ts=1444988804
- 2015-10-16 09:46:44 – Sanders vs Rubio expected case changed: Sanders 276 to Rubio 262 -> Sanders 256 to Rubio 282 http://electiongraphs.com/2016ec/?Dem=Sanders&Rep=Rubio&ts=1444988804
-
2015-10-16 09:23:18 – Sanders vs Trump state category change: PA has moved from Strong Sanders to Weak Sanders http://electiongraphs.com/2016ec/polldata.php?Dem=Sanders&Rep=Trump&State=PA&ts=1444987398
-
2015-10-16 09:50:38 – Trump best case vs Sanders has changed: Sanders 251 to Trump 287 -> Sanders 231 to Trump 307 http://electiongraphs.com/2016ec/?Dem=Sanders&Rep=Trump&ts=1444989038
Those are all tweets from @ElecCollPolls. That account tweets each and every electoral college related change on ElectionGraphs.com, including each individual poll result as it is added. If you are interested in that level of detail, follow @ElecCollPolls on Twitter.
But be careful interpreting what you see beyond the five best polled combinations I highlight here. There is often still very sparse polling, certainly when compared with the top five, and the averages still rely quite a lot on previous general election results, so it may or may not yet be giving a good picture of where things really stand for that candidate pair. You can still get some insight of course, you just have to be careful.
Here on the blog, I concentrate on the candidate pairs with the most robust polling, and on the changes that impact the range of possible results for those candidates. These “top five” candidate pairs are really where the amount of data available is best and where I can feel the most confident drawing conclusions from the data… and even then you sometimes have to be careful reading too much into things.
After all, it is still 389.1 days until polls start to close. Things will change a lot in those days. Which is why tracking this is fun. Keep watching.
Note: This post is an update based on the data on ElectionGraphs.com. All of the charts and graphs seen here are from that site. Graphs, charts and raw data can be found there for the race nationally and in each state for every candidate combination that has been polled at the state level. In addition, comparisons of the best polled candidate combinations both nationally and each in each state are available. All charts above are clickable to go to the current version of the detail page the chart is from, which may contain more up to date information than the snapshots on this page, which were current as of the time of this post. Follow @ElecCollPolls on Twitter for specific poll details as I add them. And like Election Graphs on Facebook!


SMH
Joan Hatton Meiselman liked this on Facebook.