Continuing the trend, in today’s update Clinton just weakens further. Let’s just jump right into the details:
Clinton vs Bush
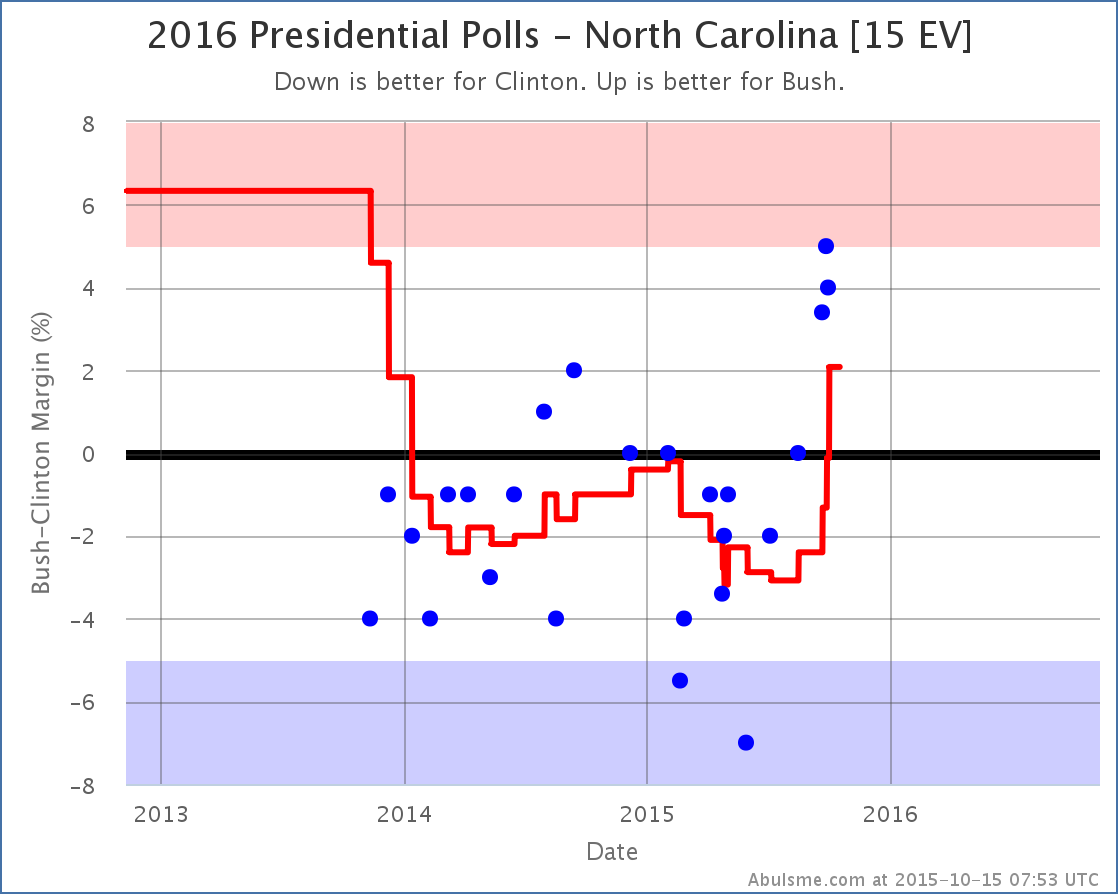
With the latest polls Bush surges to the lead in North Carolina. This has been a pretty quick move. All three polls taken since mid-September have shown a Bush lead. Before that he hadn’t managed better than a tie in North Carolina since September 2014.
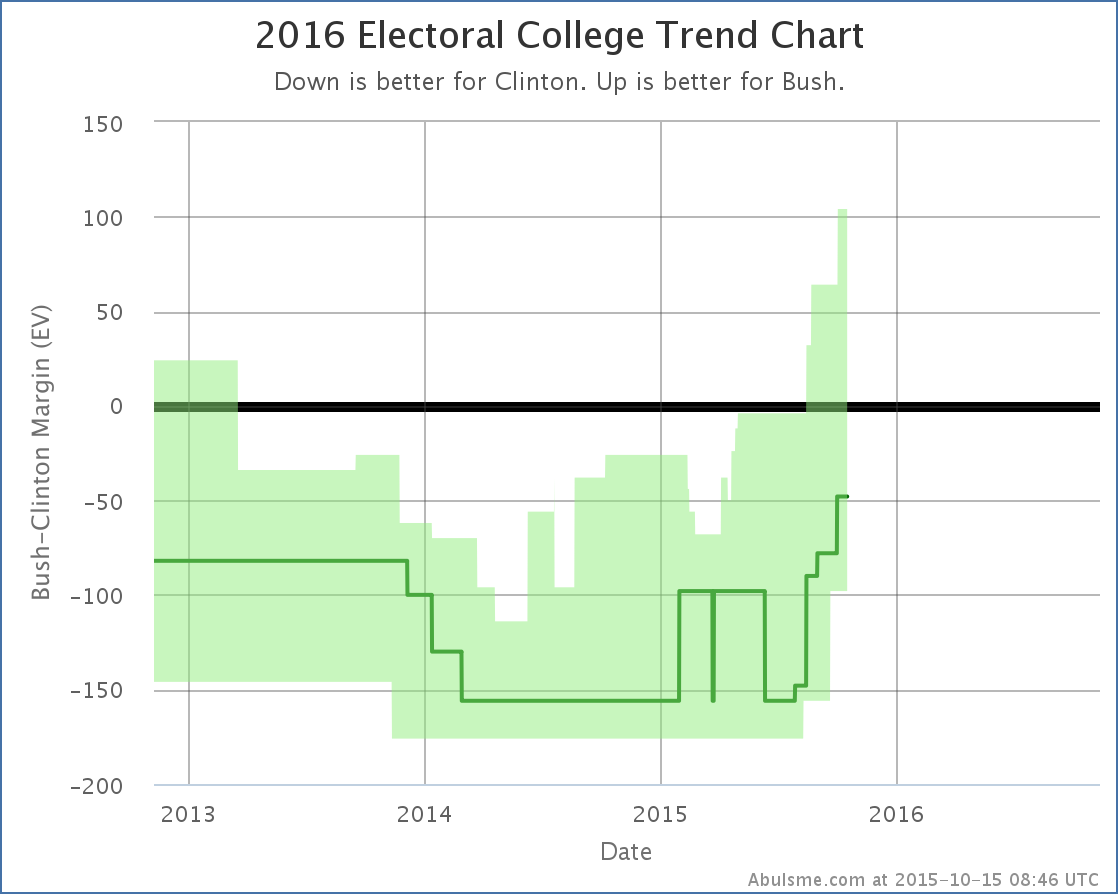
This of course improves Bush’s “expected case” where he wins all the states where he leads in my poll average:
This brings the expected result to Clinton 293 to Bush 245. Still a 48 electoral vote loss for Bush, but that is closer than it has ever been before.
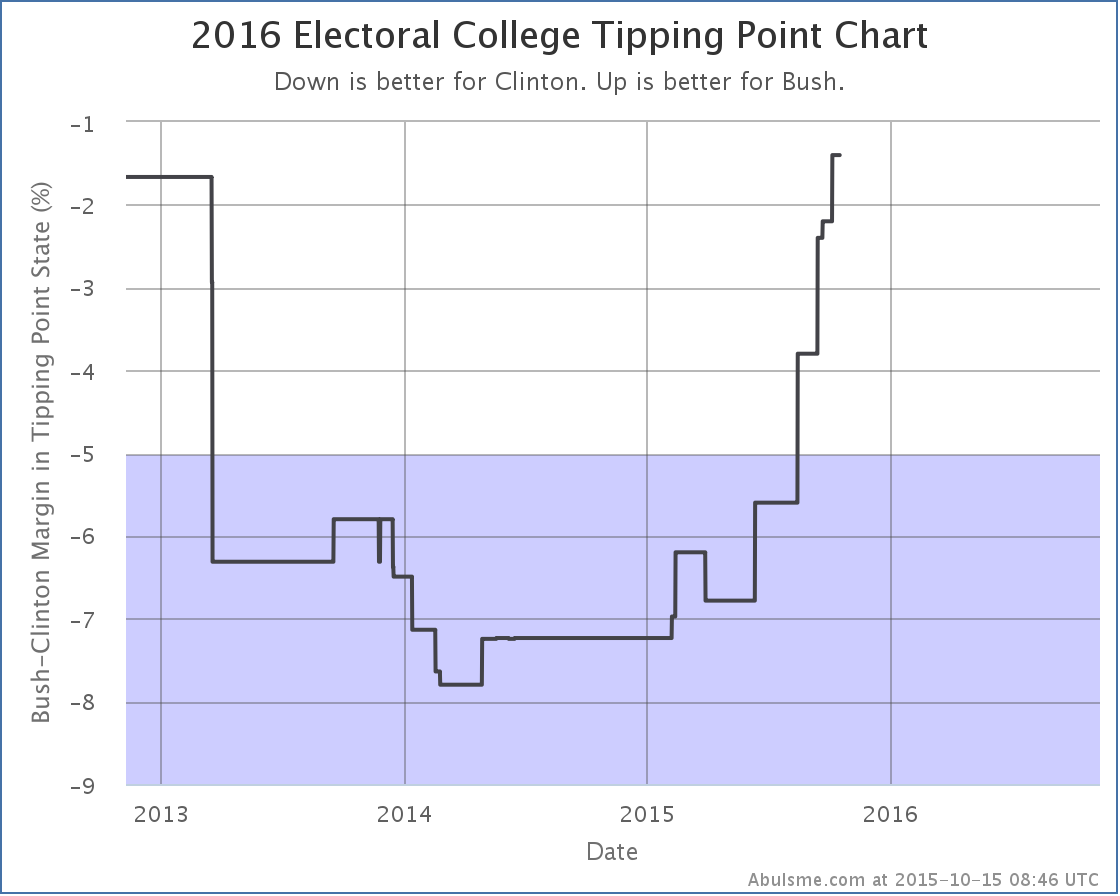
Bush also improved against Clinton in Virginia. This did not result in a category change, but it did move the tipping point further in Bush’s direction:
The tipping point is now 1.4% in Michigan in Clinton’s favor. So a national poll move of as little as 0.7% would flip the electoral college to Bush’s side. Bush may not be leading yet like Rubio is, but he is actually very close to that. His best case is to win by 104 electoral votes if he gets all the close states. So Bush is certainly competitive with Clinton at the moment.
Bush vs Christie
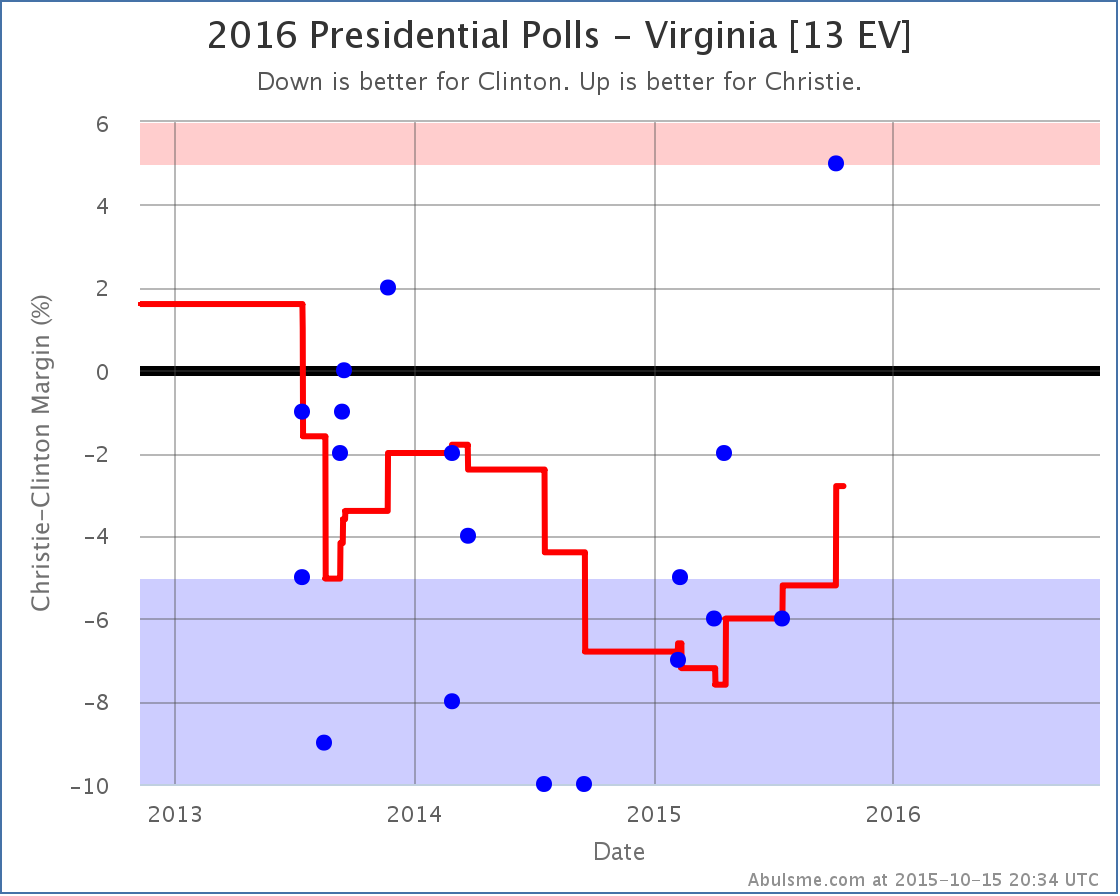
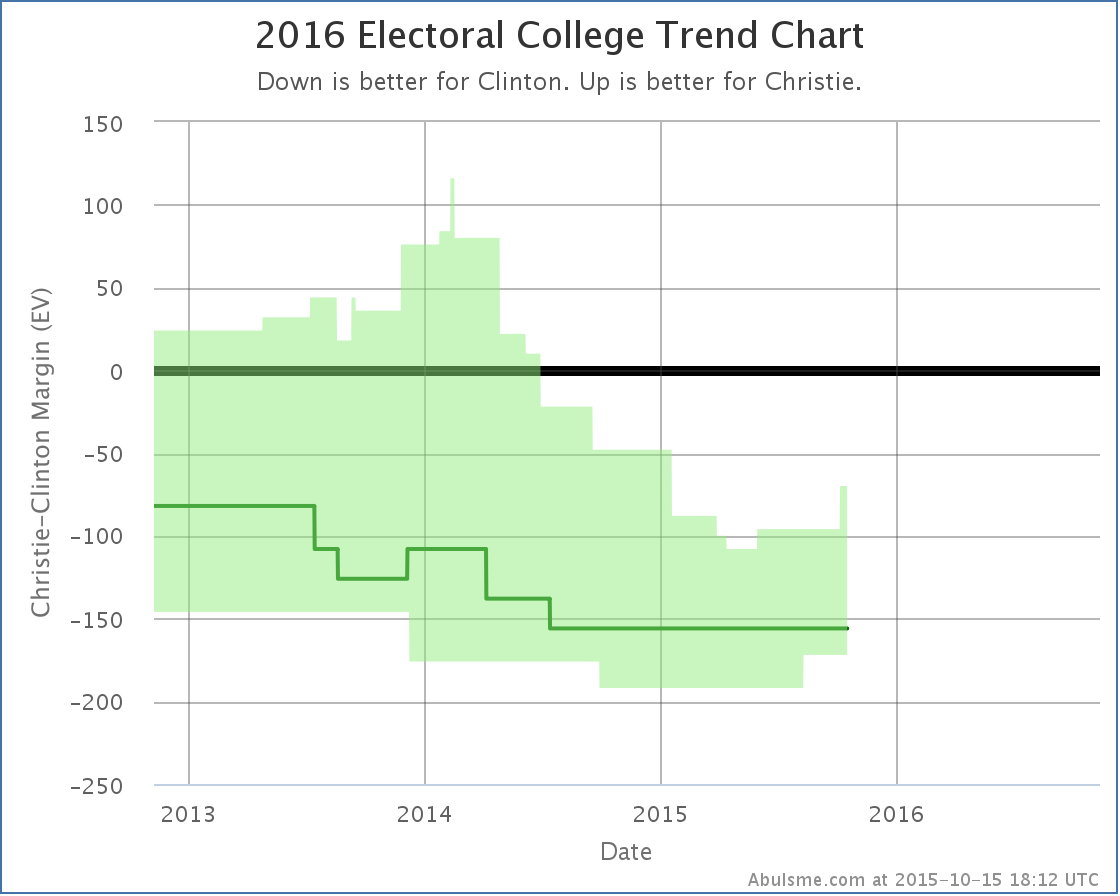
Christie? Is he still running? I thought he was just about gone. Before today’s update, nobody had bothered to include Christie in a state level poll since late August. More than a month. But CNU decided to include him in a new Virginia poll, and it improved his position in Virginia:
This drops Clinton’s lead against Christie in Virginia to only 2.8%, making the state once again a “swing state” that could go either way.
Christie’s best case, if he wins all of the close states, is now to lose by 70 electoral votes. His expected case is still to lose by 156 electoral votes. Unlike Bush, Christie is not competitive with Clinton at the moment. Things can change quickly though, so you never know! But with Christie at 1.9% in the RCP average of national Republican polls, I’m not sure if Christie will have a chance to find out.
390.1 days until the polls start to close!
Note: This post is an update based on the data on ElectionGraphs.com. All of the charts and graphs seen here are from that site. Graphs, charts and raw data can be found there for the race nationally and in each state for every candidate combination that has been polled at the state level. In addition, comparisons of the best polled candidate combinations both nationally and each in each state are available. All charts above are clickable to go to the current version of the detail page the chart is from, which may contain more up to date information than the snapshots on this page, which were current as of the time of this post. Follow @ElecCollPolls on Twitter for specific poll details as I add them. And like Election Graphs on Facebook!
