Aside from that one blip of good news in August every single update I’ve posted in many months has been more bad news for Clinton. This update is no exception, with two changes worth noting, both in favor of the Republican.
Clinton vs Bush
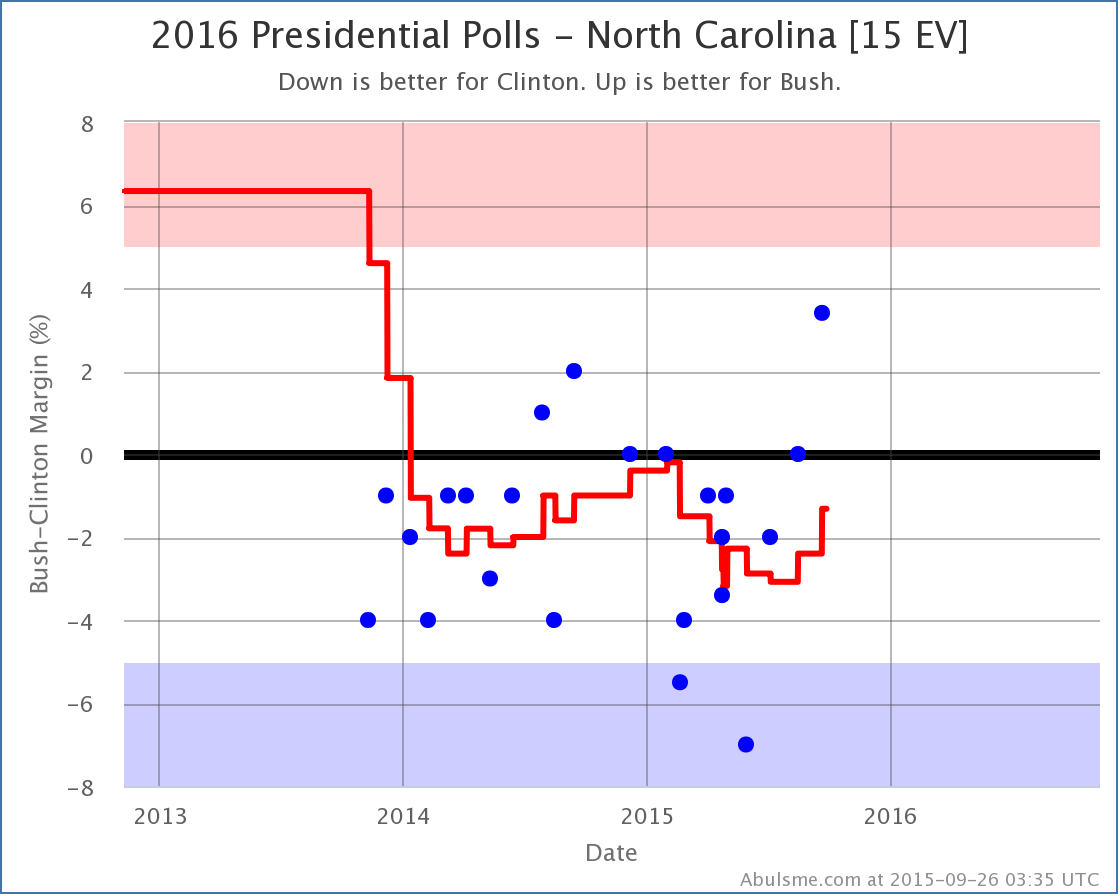
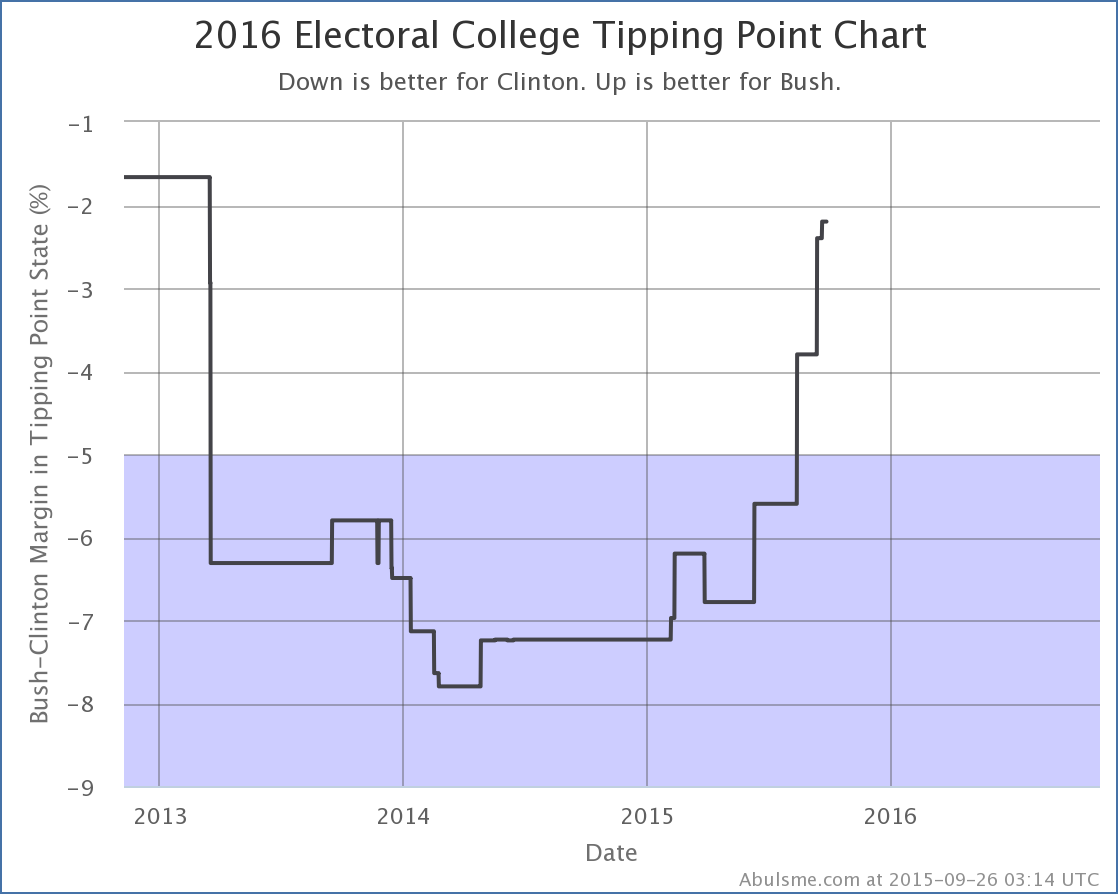
The new poll in North Carolina didn’t shift move the state to a new category, but the move from a Clinton lead of 2.4% down to a Clinton lead of 1.3% moved the tipping point, which had been North Carolina. With North Carolina shifting Bushward, the tipping point becomes Colorado, where Clinton is ahead by 2.2%.
This is a relatively small blip upward for the tipping point, but it continues the trend. This race just keeps getting closer. Remember, the tipping point is how far polls have to move nation wide in order to flip the result of the election. The gap is now only 2.2%. That is tiny. A 2.2% lead can disappear over night, or be an illusion cased by a bias in the polls. Right now, Bush and Clinton are effectively neck and neck. Yes, Clinton has a lead, but it is extremely narrow.
The spectrum of the states now looks like this:
Clinton’s buffer is down to just Colorado, Michigan and North Carolina, all states where her lead is less than 2.2%. We’re only a few Republican leaning polls in those three states away from having a Republican in the lead for the first time since I launched this site.
Clinton vs Walker
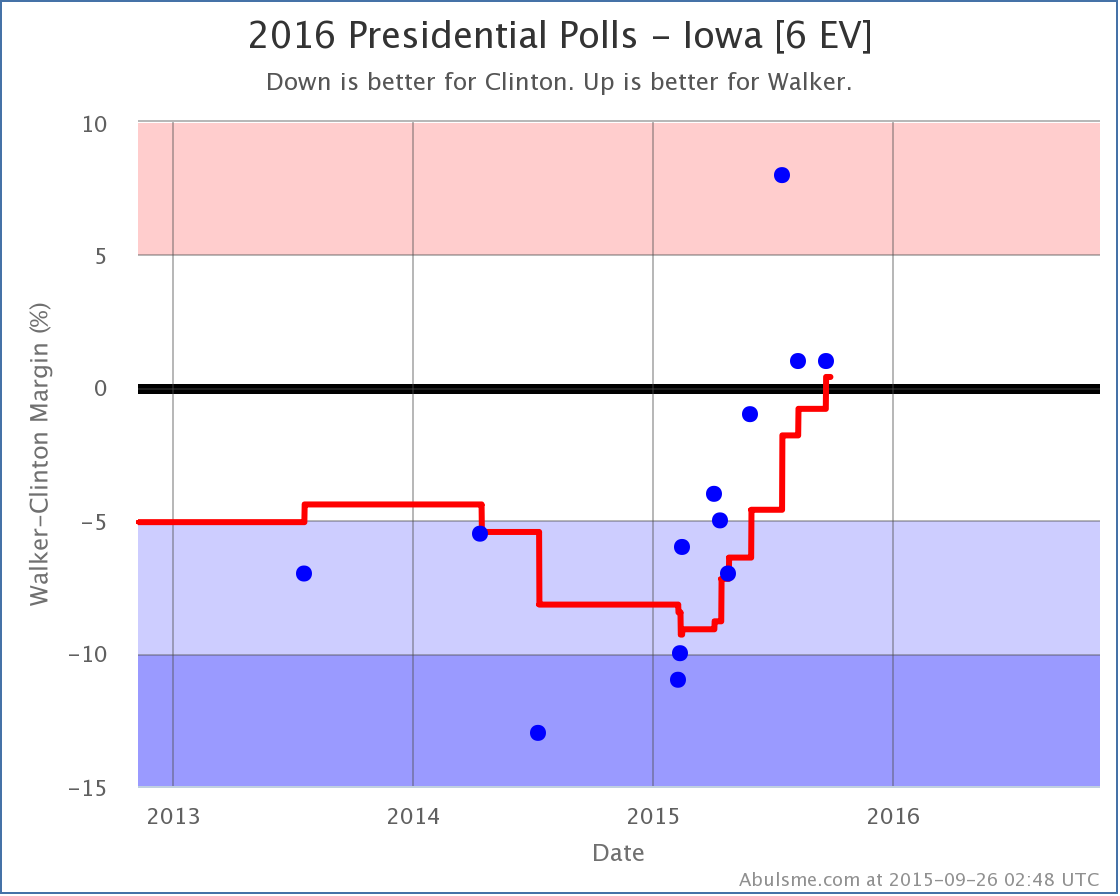
Well, he dropped out. But a poll in Iowa that included him wrapped up just before his announcement. And that poll was good for Walker. So, one last hurrah…
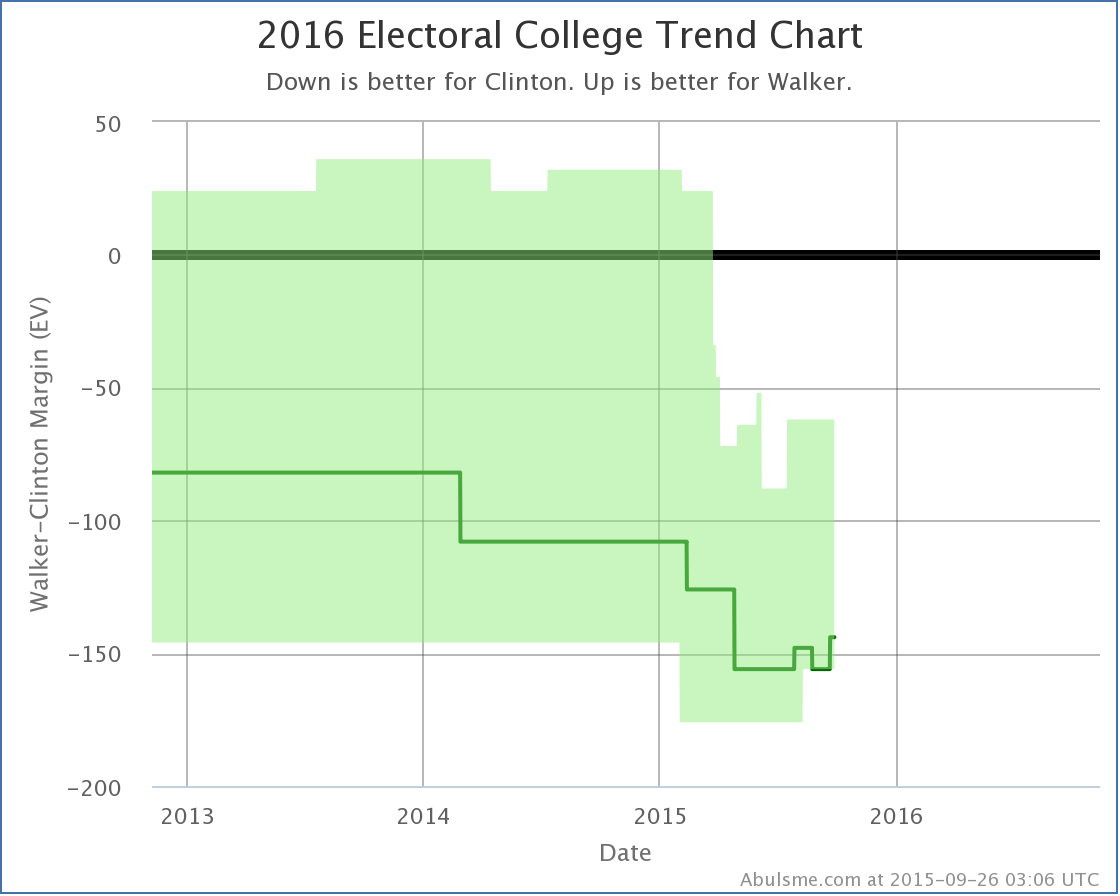
With this last poll… and it will be surprising if there are any more with Walker… Walker takes a narrow lead vs Clinton, and so moved Iowa into his column, increasing his “expected” result against Clinton…
He increases his expected result to… losing by 144 electoral votes! Well, OK, Walker wasn’t the most competitive of the Republican candidates against Clinton.
Goodbye Walker.
409.8 days until polls start to close.
Note: This post is an update based on the data on ElectionGraphs.com. All of the charts and graphs seen here are from that site. Graphs, charts and raw data can be found there for the race nationally and in each state for every candidate combination that has been polled at the state level. In addition, comparisons of the best polled candidate combinations both nationally and each in each state are available. All charts above are clickable to go to the current version of the detail page the chart is from, which may contain more up to date information than the snapshots on this page, which were current as of the time of this post. Follow @ElecCollPolls on Twitter for specific poll details as I add them.


