Clinton’s deterioration against the Republican field continues. There are two changes of note today, both show Republicans getting stronger against Clinton.
Clinton vs Rubio
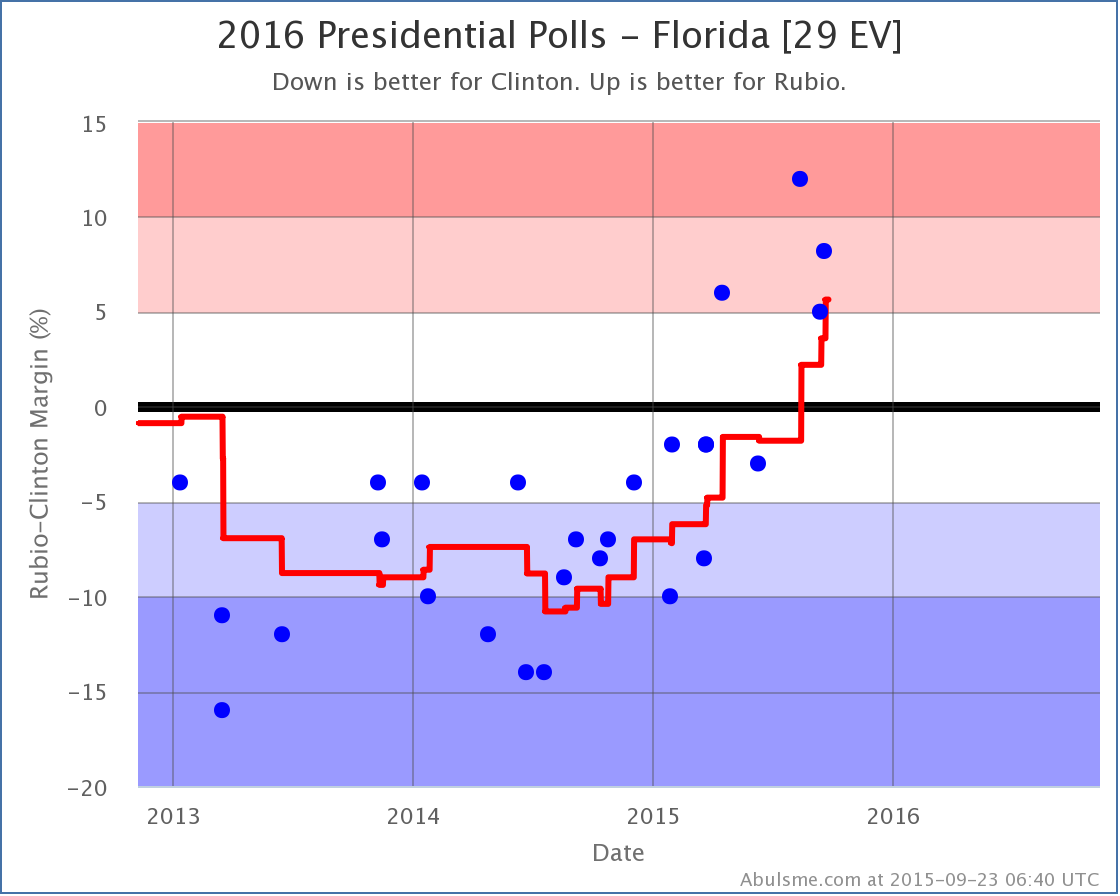
Clinton has now not been ahead in a Clinton vs Rubio poll in Florida since June. And four of the five polls in the average show Rubio leads of 5% or more. With the latest one of these polls, my poll average now shows Rubio’s lead in Florida as 5.6%. That takes Florida out of the “close state” category. So Clinton’s “best case” no longer includes winning Florida.
The scale of this collapse in Florida is particularly striking. As recently as last October, Clinton had a greater than 10% lead against Rubio in Florida. This put Florida in the “Solid Clinton” category. But over the course of the last year, that lead evaporated. And now Rubio is not just ahead, but significantly ahead. Now, this chart itself is a perfect example of how much things can change in a year. We are too far away for election day for this to be predictive of what would actually happen in Florida in a Clinton vs Rubio race next year. But this still looks very bad for Clinton.
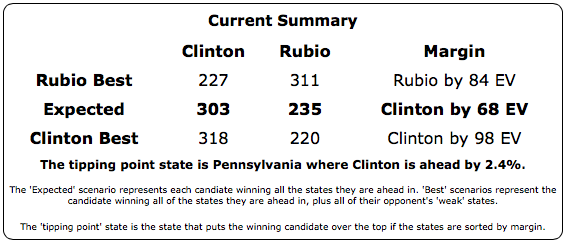
The new situation summary for Clinton looks like this:
Clinton is still ahead… barely. But it is looking much more like a toss up. A tipping point of 2.4% could literally disappear overnight with the right events happening in the campaign. As recently as March, Rubio’s best case was to lose by 96 electoral votes. Now Clinton vs Rubio is too close to make a confident prediction, and even Clinton’s best case is deteriorating.
Florida is a big state, Florida is important. Clinton being this far behind in Florida is a significant issue for Clinton. Clinton doesn’t NEED Florida to win, but the paths without it are much tighter.
Clinton vs Bush
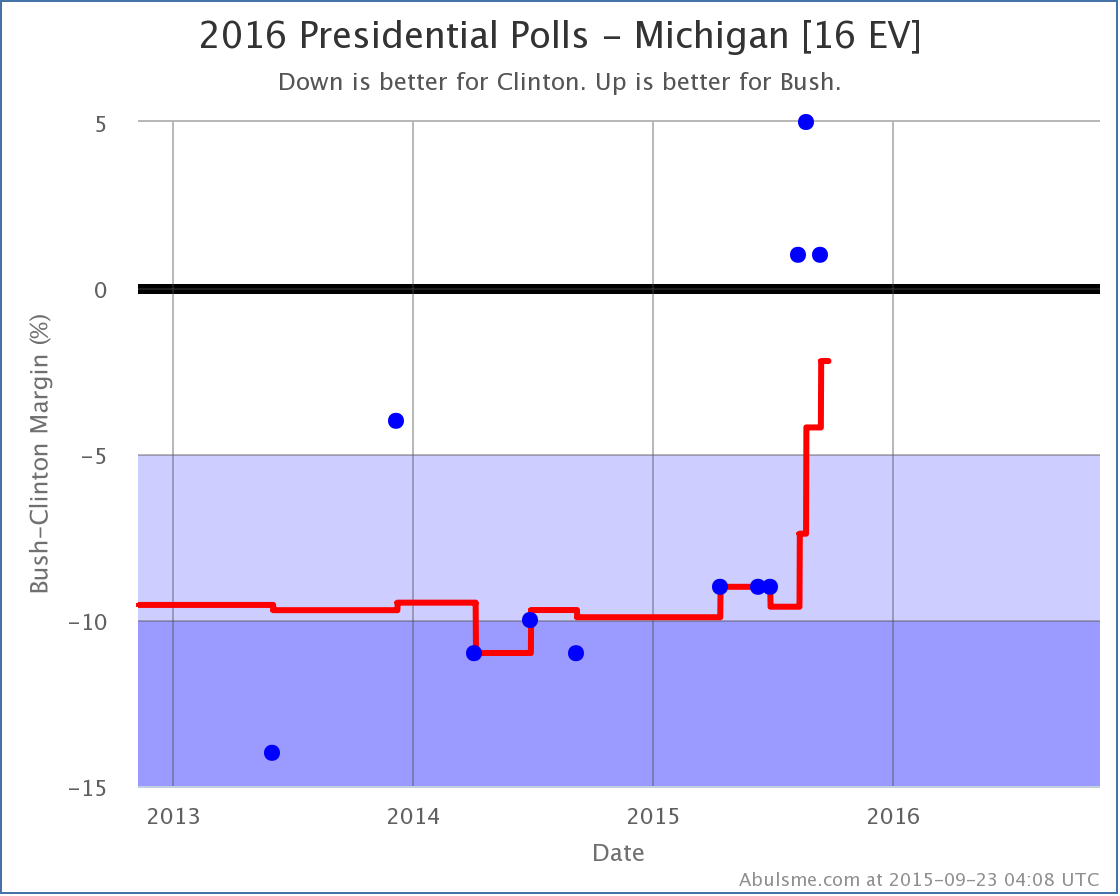
The latest results in Michigan for Clinton vs Bush don’t change the category of the state. It was “Weak Clinton” before the latest poll, and is “Weak Clinton” after the poll. But the move from Clinton by 4.2% to Clinton by 2.2% moved Michigan past several other states when you order the states by Clinton vs Bush margin, including moving past Ohio, which had been the tipping point state. Without Michigan to the left of Ohio, the tipping point moved from Clinton by 3.8% in Ohio, to Clinton by 2.4% in North Carolina.
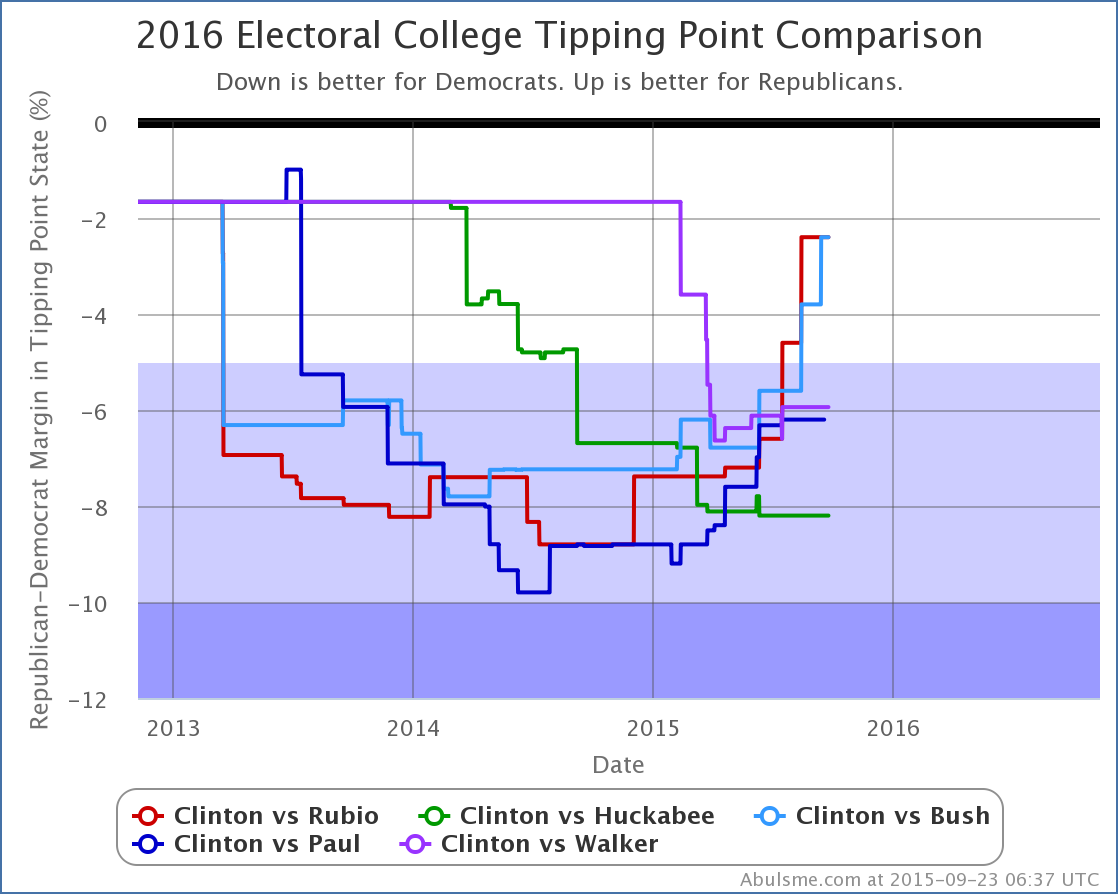
Only four very close states, all with margins at 2.4% or less, need to flip to put Bush in the lead. In terms of tipping point, Clinton vs Bush is now tied with Clinton vs Rubio as the two of the five best polled candidate pairs that do the best against Clinton.
(Walker has of course now dropped out, he will likely be replaced in this comparison chart soon.)
When looking at the tipping point across these five candidate matches, while all but Huckabee made significant gains over Clinton in the last year, it is clear that in the last few months only Rubio and Bush have continued that movement in the last few months… but they have moved things significantly. The picture for the general election is starting to look very different depending on which Republican is up against Clinton.
What about Trump? Carson? Fiorina? Or what about Sanders and Biden? The bottom line is that compared to the candidates above, they simply have not been considered “serious candidates” for long enough to have a significant amount of state level polling. In my ranking of the best polled candidate combinations, Clinton vs Fiorina is #21, Clinton vs Carson is #22, Clinton vs Trump is #23. The highest combination with Sanders is #9. The highest with Biden is #10. You can look at these combinations if you want, but frankly there simply has not been enough polling yet on the state level to get a good picture of what those races really would look like, so interpret anything you see there with extreme caution.
412.4 days until polls start to close.
Note: This post is an update based on the data on ElectionGraphs.com. All of the charts and graphs seen here are from that site. Graphs, charts and raw data can be found there for the race nationally and in each state for every candidate combination that has been polled at the state level. In addition, comparisons of the best polled candidate combinations both nationally and each in each state are available. All charts above are clickable to go to the current version of the detail page the chart is from, which may contain more up to date information than the snapshots on this page, which were current as of the time of this post. Follow @ElecCollPolls on Twitter for specific poll details as I add them.


