- 00:57:33 Retweeted @imbou 00:56:54 LIVE on #Periscope https://t.co/k1qbCXEpzo
- 00:59:26 Live stream of @imbou, @cnh2r1 and I recording Curmudgeon's Corner in the same room, not by Skype! https://t.co/SlmMQSx68U
- 03:44:00 Successful in person recording of Curmudgeon’s Corner complete. Heading back to my dad’s house on metro now. Episode out in a little while.
- 03:44:41 Retweeted @daveweigel 2015-08-12 23:35:16 Did we really have 223 years of presidential elections without Donald Trump in them? What was the point?
- 03:48:03 Retweeted @sinderbrand 2015-08-12 23:34:17 Trump reax to Rand Paul's attack ad, via @daveweigel: The senator's campaign is full of crooks, and he sucks at golf. http://t.co/hg8SBKCWN5
- 03:56:01 Retweeted @emptywheel 2015-08-12 21:39:40 Hillary deserves a great deal of criticism she's getting. But press is being very sloppy w/phrase "Hillary's emails."
- 03:56:02 Retweeted @emptywheel 2015-08-12 21:40:25 There is a difference between "emails Hillary sent" and "emails Hillary's staff sent her," especially if emails not marked w/classification.
- 03:59:17 Retweeted @daveweigel 2015-08-12 23:46:38 Now the Rand campaign has responded to @realDonaldTrump responding to Rand. http://t.co/A45Pc706Xf http://t.co/50LeYjnTbd
- 04:00:42 Retweeted @jeets 2015-08-12 18:55:37 LOL, this @latimes correction is pretty much the best: http://t.co/xecs7uDkG6
- 04:51:44 Retweeted @NYTMinusContext 2015-08-12 13:19:00 a lot of things make me sad and frightened, especially when it comes to the Internet
- 04:59:35 Retweeted @akari5c 2015-08-12 19:20:32 Just used the #Abulsme function to disprove the Cruel Angel's Thesis.
- 08:17:44 [Abulpost] Curmudgeon's Corner: Hit the Green Button!! http://t.co/eYtjvEavL0
- 16:12:31 Watching – Tianjin, China Explosion Synced Up (Panthersfan1993) https://t.co/N0RkCNtTWw
- 18:18:18 Reading – What's The Fastest (Fictional) Spaceship In The Universe? [Danielle Andrew] http://t.co/8HJMs0lFjE
- 20:19:46 Retweeted @reidepstein 19:24:41 Jeb: "I'll tell you, taking out Saddam Hussein turned out to be a pretty good deal."
|
Ivan and Sam travel to the same room in the same city to do this week’s Curmudgeon’s Corner podcast, joined this week by their college buddy Chad. Along with some stories of college hijinks, the main topics were the aftermath of the first Republican debates, a discussion on Clinton’s weakening position and if it is enough for Biden to jump in, and the continuing impact of Clinton’s email issues. In the lightning round we cover a houseplant that tells you when it is thirsty, the toxic sludge spill, problems with the Olympics, Google Alphabet, and a lot more! Length this week – 1:27:35
Show Details:
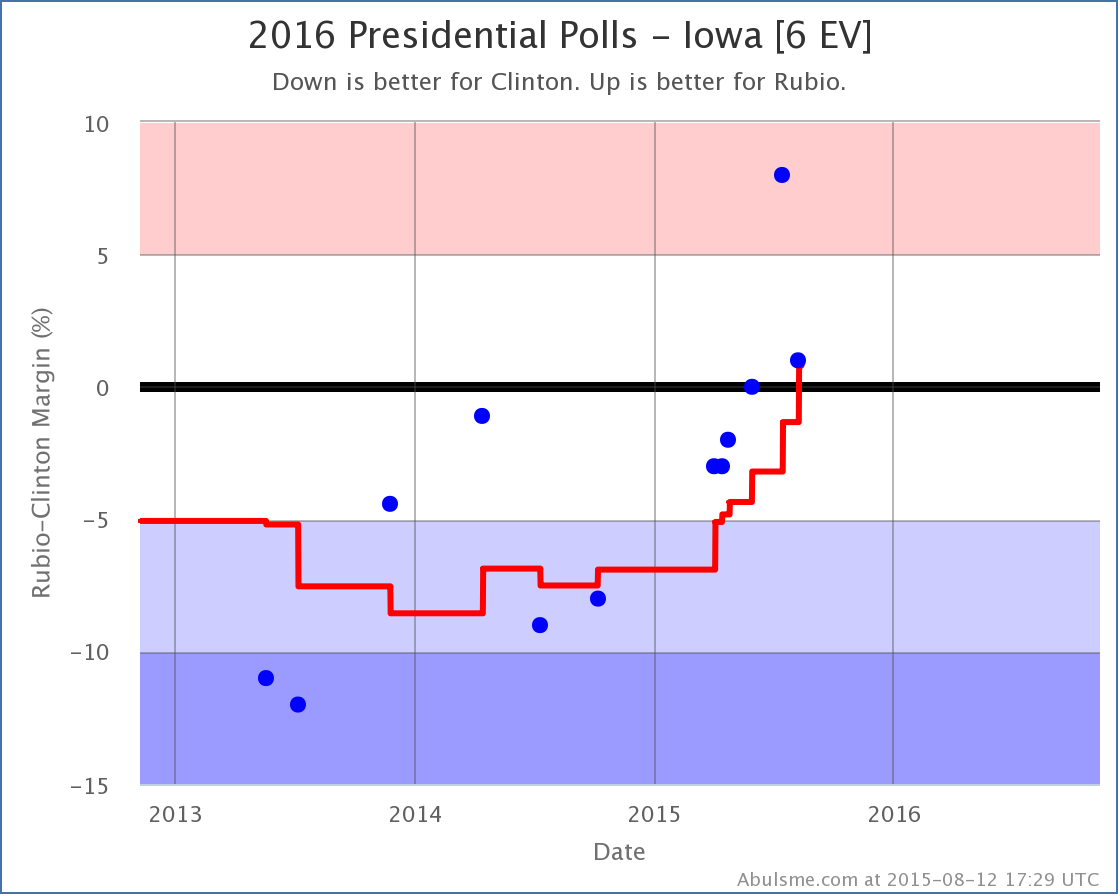
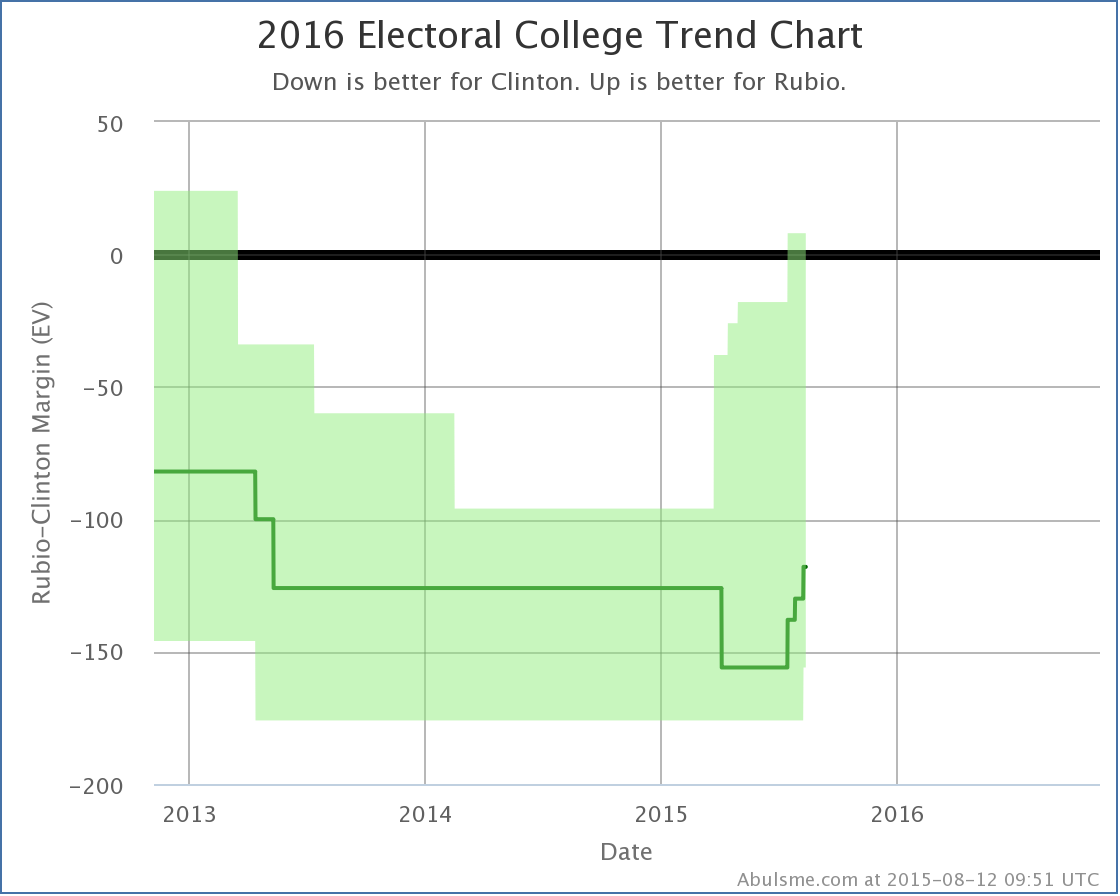
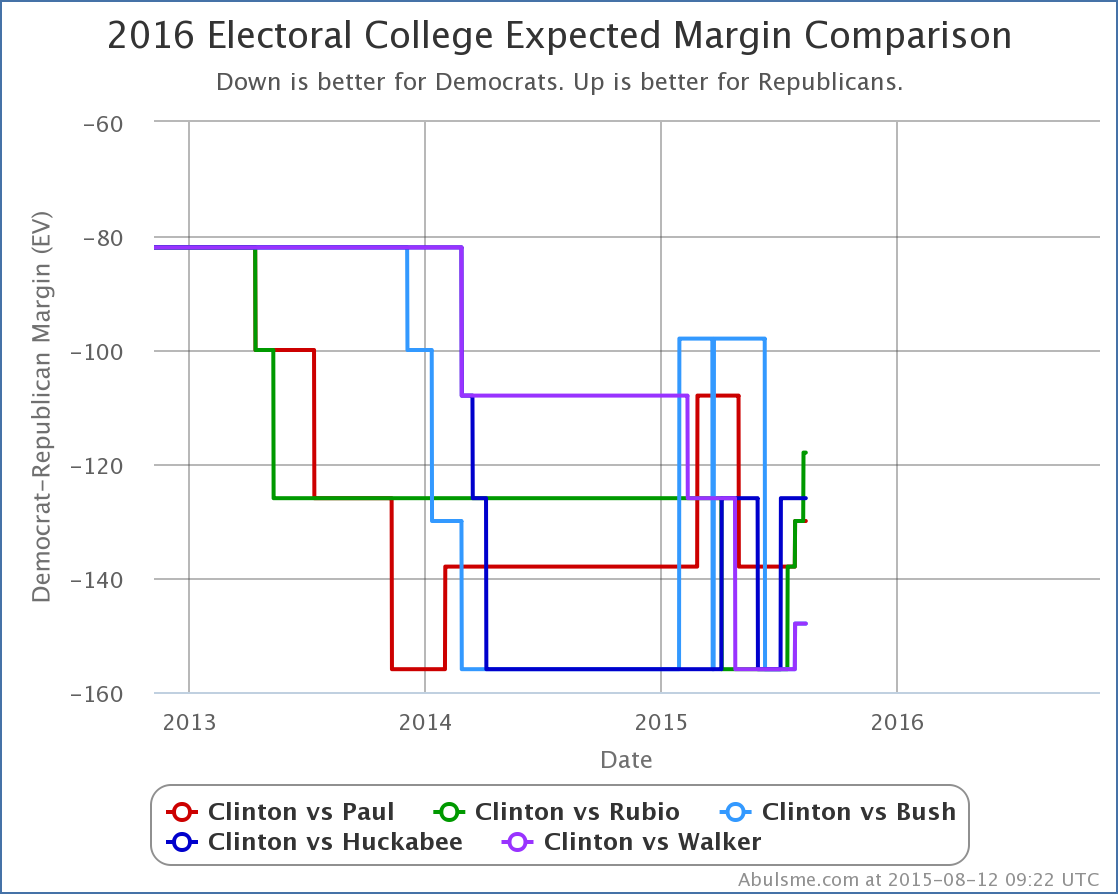
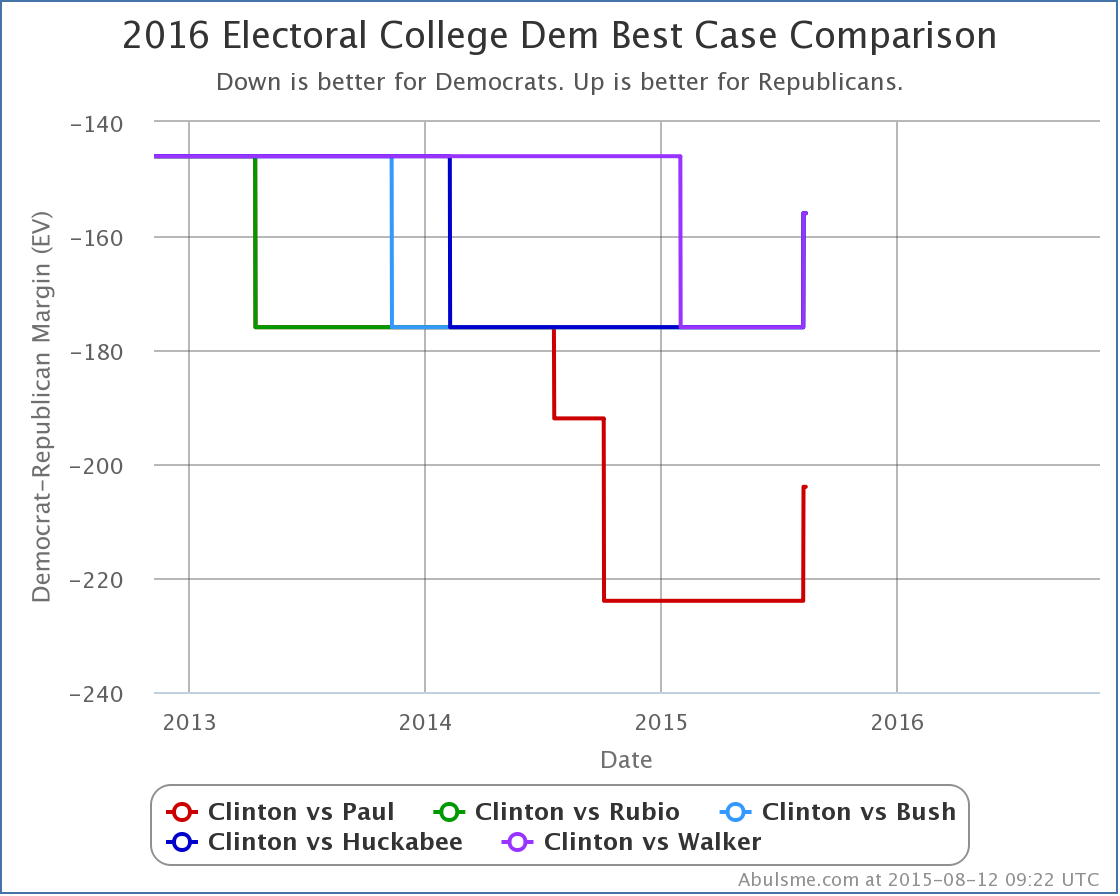
Two sets of changes worth noting today triggered by new PPP polls in Iowa and Missouri. The streak of changes going against Clinton and in favor of the various Republicans continues. As I mentioned before, the last time one of my updates was unequivocally good news for Clinton was in May! Iowa The July Qunnipiac Poll showing Rubio with an 8% is looking kind of like an outlier, and without it we wouldn’t be quite there yet, but there has been a clear trend toward Rubio in the average going back a year. With the newest poll (plus that possible outlier) the average moves from “Weak Clinton” to “Weak Rubio”. This changes the “expected” result in this matchup: The expected result is now Clinton 328 to Rubio 210, which is a 118 electoral point loss by Rubio. Now, while this is still of course a significant loss, it is significant because it beats Romney’s 126 electoral vote loss against Obama in 2012. The last time one of the five best polled candidate combinations had the Republican outperforming Romney was back in June when Bush had pulled his expected loss down to only 98 electoral votes. While there has been a general drumbeat of bad news for Clinton in my updates for the last three months, this particular chart doesn’t yet show an clear and indisputable breakout move beyond the range where these candidates have been bouncing around. If you only look at the changes since June, it starts to look like a trend though, and given the movement in other metrics, it is still reasonable to interpret this as a bad trend for Clinton. The question though will be if the Republicans can start an actual breakout move where instead of talking about how it looks like they might beat Romney, we start talking about how it looks like they might beat Clinton. We aren’t close to that yet. One thing people have been speculating about has been if the prominence of Trump on the Republican side right now is actually harming the party overall, specifically in terms of the ability of the other candidates to compete against Clinton. So far, there is no evidence for that at all in the numbers we track here. Missouri When I officially launched the election tracking site and posted my first analysis for 2016 I mentioned that if you looked at the average results for the last five general elections… the data I used to “seed” the analysis before there were actual state polls… there were only SIX states where the average margin in these five elections was less than 5%. They were Nevada (Dem+2.8%), Ohio (Dem+1.7%), Florida (Dem+0.9%), Colorado (Rep+0.0%), Virginia (Rep+1.6%) and Missouri (Rep+2.8%). All of these states were polled long ago, some many times… except Missouri. Today’s PPP poll is the first 2016 polling for Missouri that I am aware of. So finally, we get a current view of the state. Missouri was basically on this “Close State” list because Bill Clinton won the state by 6.3% in 1996, the oldest of the five elections I used for the initial average. Since then the Republicans won by 3.3%, 7.2%, 0.1%, and 9.4%. OK, that 0.1% in 2008 was really close. And the 3.3% in 2000 wasn’t a complete blow out. But in general it seems like the trend has been redder in Missouri. The new poll tested Clinton against 11 different Republicans. She lost by between 7% and 15% depending on which Republican you looked at. (They also tested Sanders against 4 Republicans with similar results.) Bottom line, looks like 2016 is looking a lot more like 2012 or 2004 than 2008 or 2000. That is, a pretty strongly Republican state. Now, it is just one poll, but the results are strong enough that the state immediately moved from “Weak Republican” to “Strong Republican” for all five of the best polled candidate combinations. (And actually for all the rest of the combinations they polled too.) The chart of this isn’t actually all that interesting on a state level. But Missouri no longer being a close state means that Clinton’s “best case” against all five Republicans weakens a little bit, so lets have a quick look at that graph: You don’t see a lot of volatility in this chart, simply because there are a lot fewer polls of the states that make a difference here. You see a lot of polls around the tipping point, and around the states that are really close, because they give insight into if the Republicans are catching up. Given the current state of Clinton’s lead, polling of the states Republicans are generally already ahead in only gives insight into how much extra Clinton could win by if everything possible went her way, which is fundamentally less interesting. Never the less, with Missouri’s 10 electoral votes out of play at the moment, Clinton’s best case margin drops by 20 electoral votes against all these candidates. In the case where she wins all the states she is ahead in, plus all the states where the Republican currently leads by less than 5%, she now beats Paul by 204 electoral votes. Rubio, Bush, Huckabee and Walker get beaten by a more modest 156 electoral votes. These are of course pretty good margins in today’s polarized electorate. But to get to these kinds of numbers, just about everything would have to go Clinton’s way… which is not the trend today. But of course, we have 454.2 days until the election. Lots can change in 454.2 days. :-) Best Polled List I should also mention that the “best polled” list got shuffled a bit with the latest updates. Clinton vs Paul once again grabs the “best polled” spot and becomes the default view on election2016.abulsme.com. Meanwhile Clinton vs Christie drops to 6th place and out of the group we highlight here, replaced by Clinton vs Huckabee returning to the top five after a short absence. Clinton vs Huckabee is just barely out of the top 5, but any other candidate combinations are far behind in terms of the volume and breadth of available polling on the state level at the moment. We’re currently giving the most attention here to Clinton vs Paul, Rubio, Bush, Huckabee and Walker. Note: This post is an update based on the data on my 2016 Electoral College Analysis Site. All of the charts and graphs seen here are from that site. Graphs, charts and raw data can be found there for the race nationally and in each state for every candidate combination that has been polled at the state level. In addition, comparisons of the best polled candidate combinations both nationally and each in each state are available. All charts above are clickable to go to the current version of the detail page the chart is from, which may contain more up to date information than the snapshots on this page, which were current as of the time of this post. Follow @ElecCollPolls on Twitter for specific poll details as I add them.
|
||


