I’ve mentioned a number of times at this point that Clinton has had a long streak of bad news. The last time one of my updates was unambiguously positive for Clinton was back in May! That streak ends today, with movement in New Hampshire prompted by a new PPP poll.
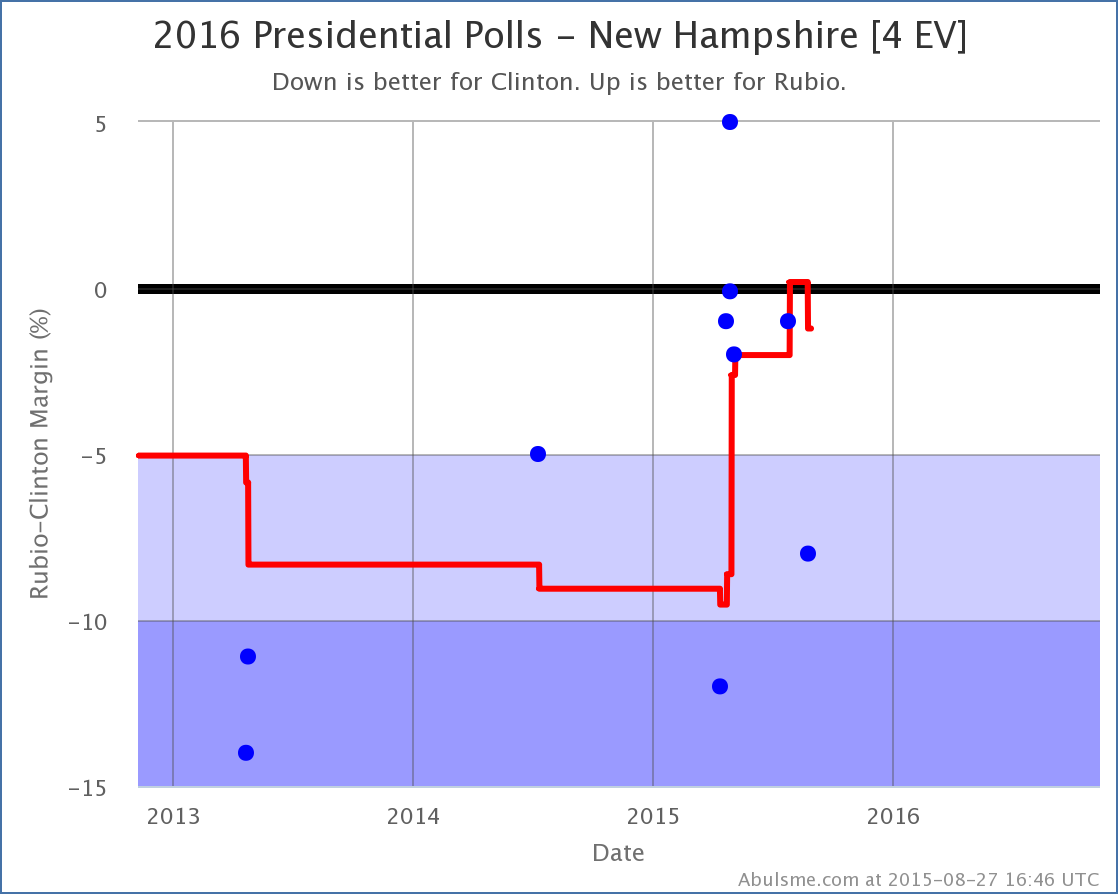
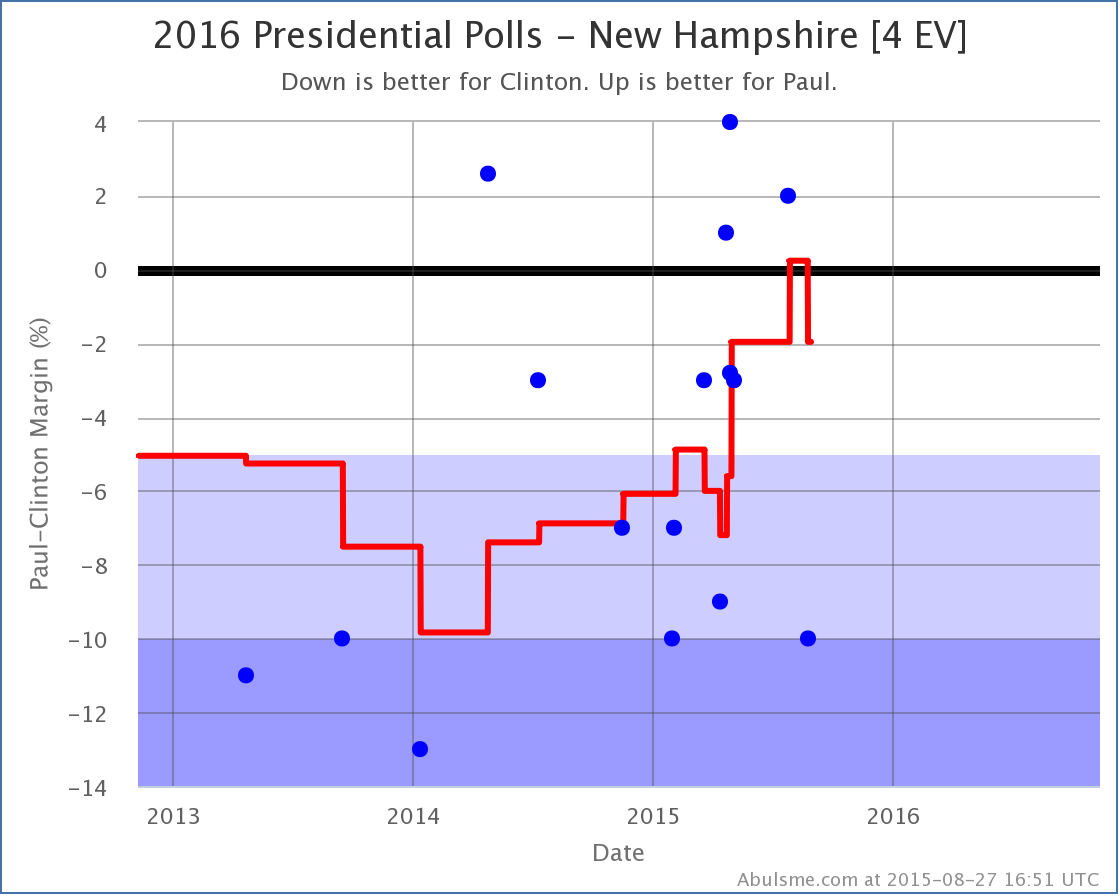
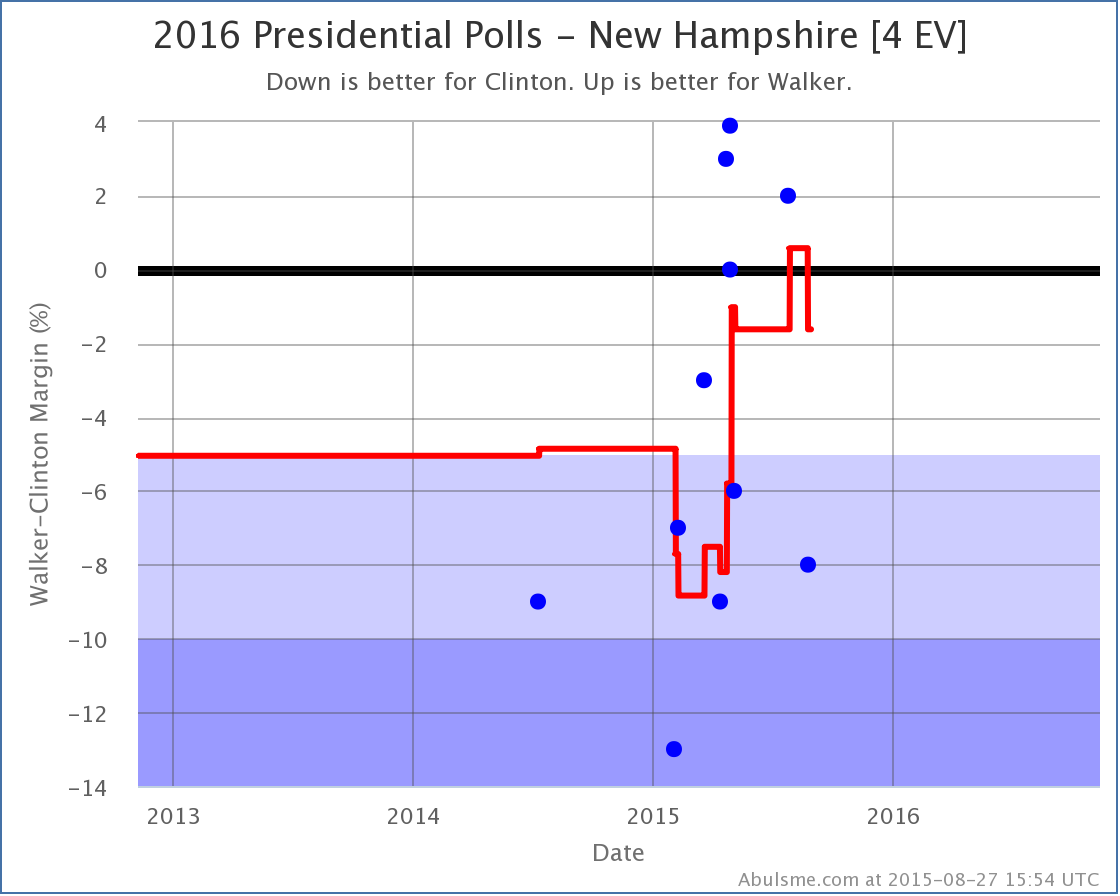
Three of the top five best polled candidate combinations flipped from “Weak Republican” to “Weak Clinton” because of this update:
So for Rubio, Paul and Walker, New Hampshire flips back to blue (although not by much). Clinton vs Bush just narrowly avoided doing the same thing, as Bush’s margin declined from 1.6% to 0.2%, but didn’t quite pass over the line.
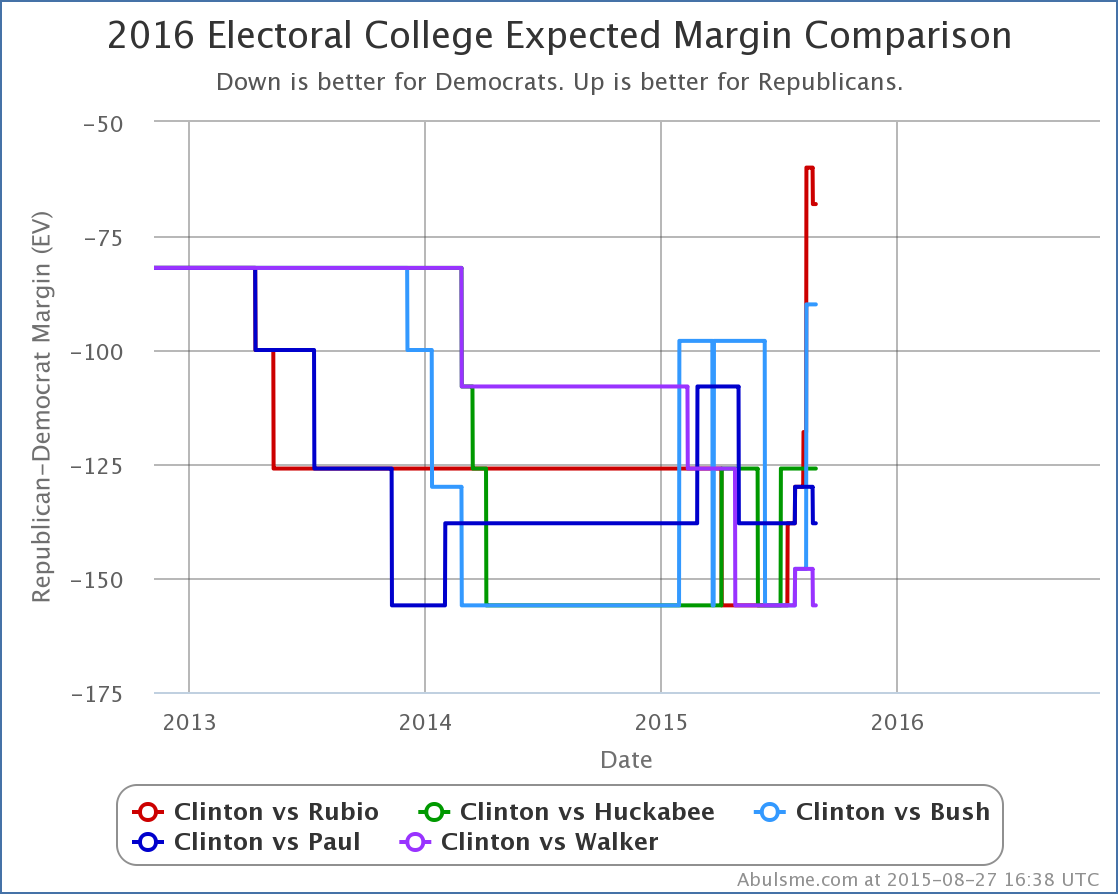
New Hampshire is a little state. Only 4 electoral votes. If you look at the “expected cases” this just makes a small move for each of these three candidates:
As a move, this isn’t all that much. And Clinton is significantly ahead on this metric against all five Republicans. So New Hampshire’s electoral votes aren’t determining the outcome here.
But after three months solid of posts where I’ve been talking about how the Republican position is getting stronger, and Clinton’s position was getting weaker, is there significance to a move, any move, actually going in Clinton’s direction? Well, maybe. But one point does not make a trend.
This could be an indicator that Clinton has bottomed for now and we’re not going to see further declines for the time being. Or, just as easily, perhaps these PPP results are a significant outlier, and not representative of an actual change of mood in New Hampshire, in which case the next New Hampshire polls may pull the state back into the red zone.
As usual, we will just have to wait and see. In the meantime though, Clinton’s losing streak has been broken.
493.0 days until polls start closing.
Note: This post is an update based on the data on ElectionGraphs.com. All of the charts and graphs seen here are from that site. Graphs, charts and raw data can be found there for the race nationally and in each state for every candidate combination that has been polled at the state level. In addition, comparisons of the best polled candidate combinations both nationally and each in each state are available. All charts above are clickable to go to the current version of the detail page the chart is from, which may contain more up to date information than the snapshots on this page, which were current as of the time of this post. Follow @ElecCollPolls on Twitter for specific poll details as I add them.


