With today’s batch of polls added, Clinton vs Paul goes back to being the “best polled” candidate combination by my metric and thus is again the default view on election2016.abulsme.com. No status changes on Clinton vs Paul though.
There were however two other status changes of note that I’ll highlight here. (There were status changes below the five best polled candidate combinations as well, see @ElecCollPolls for those, or for details of the specific polls added today.)
Clinton vs Huckabee
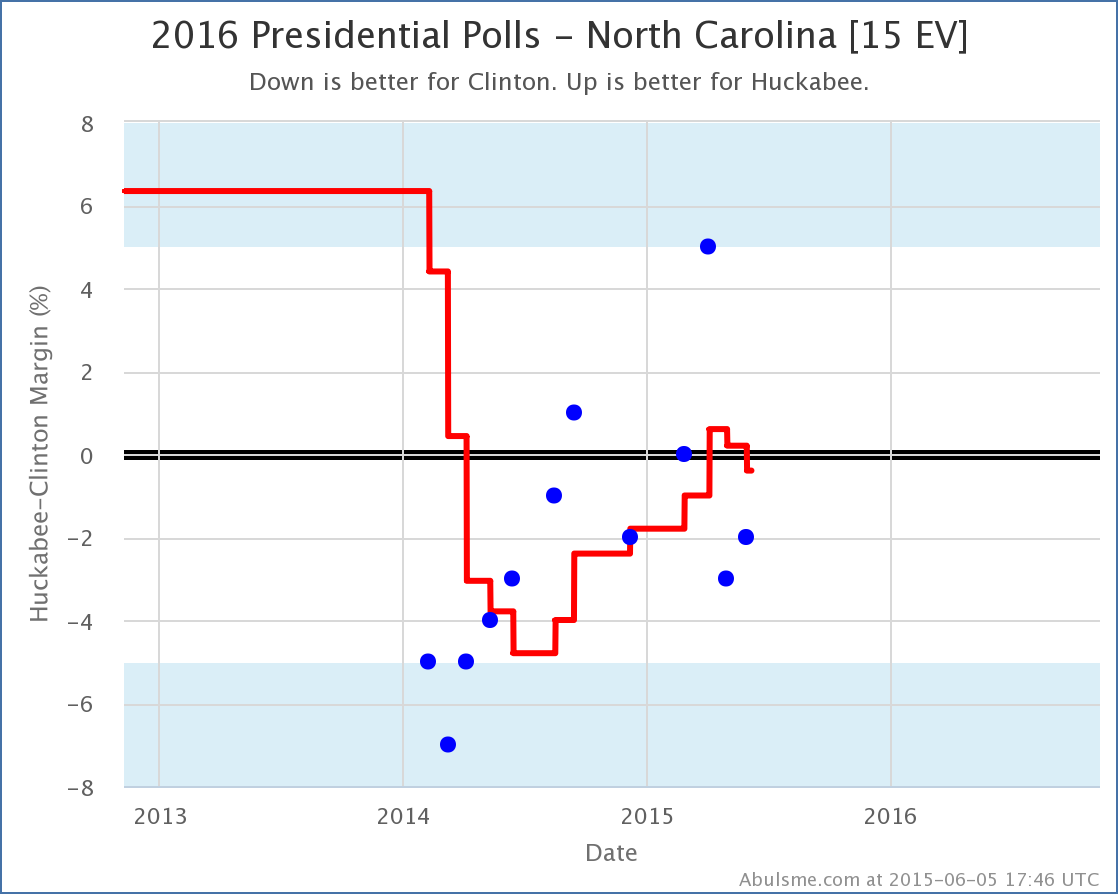
After a flirtation in April and May with actually leading Clinton in North Carolina, the state moves from just barely Huckabee, to just barely Clinton. Either way, North Carolina looks close in this matchup for the moment. This does however change the “expected” result in this match up in Clinton’s favor:
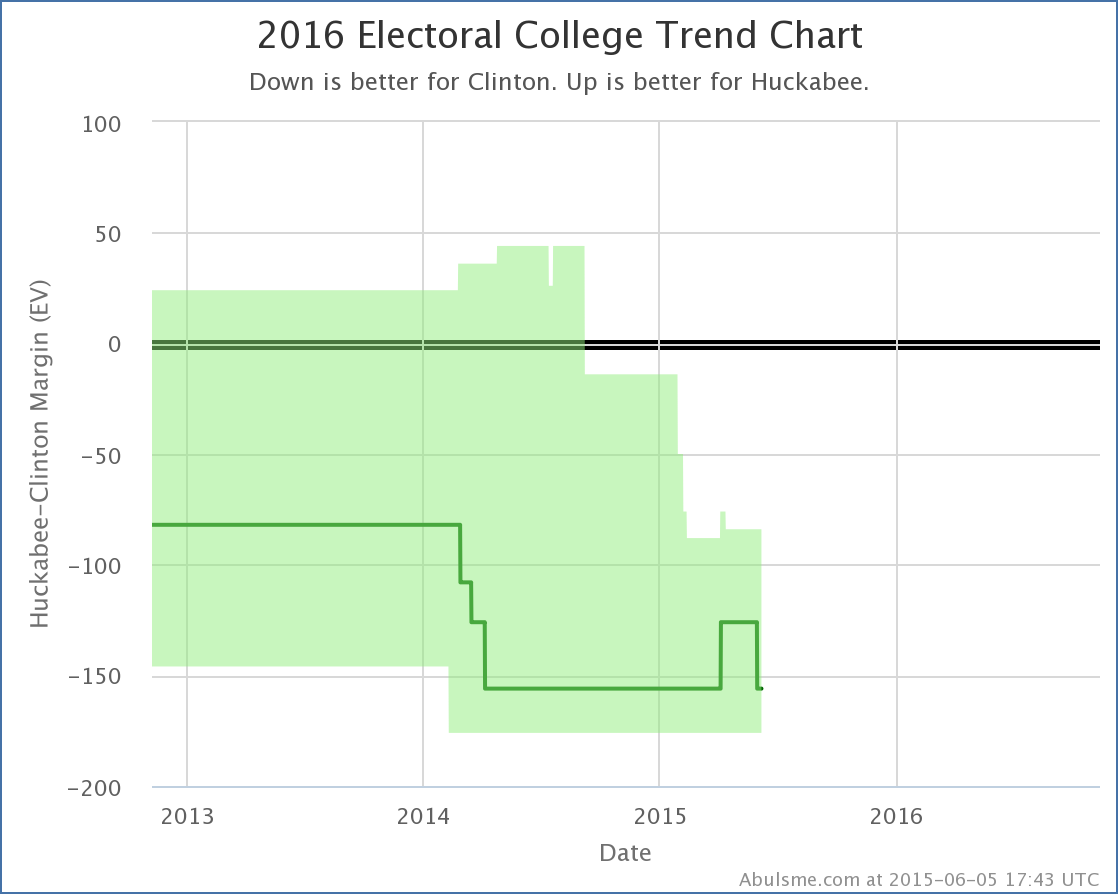
With this, the expected result… where each candidate wins all the states where they are currently ahead… returns to Huckabee losing by 156 electoral votes. (Specifically Clinton 347, Huckabee 191.) This has been the “expected” Clinton vs Huckabee result for most of the last year.
Clinton vs Christie
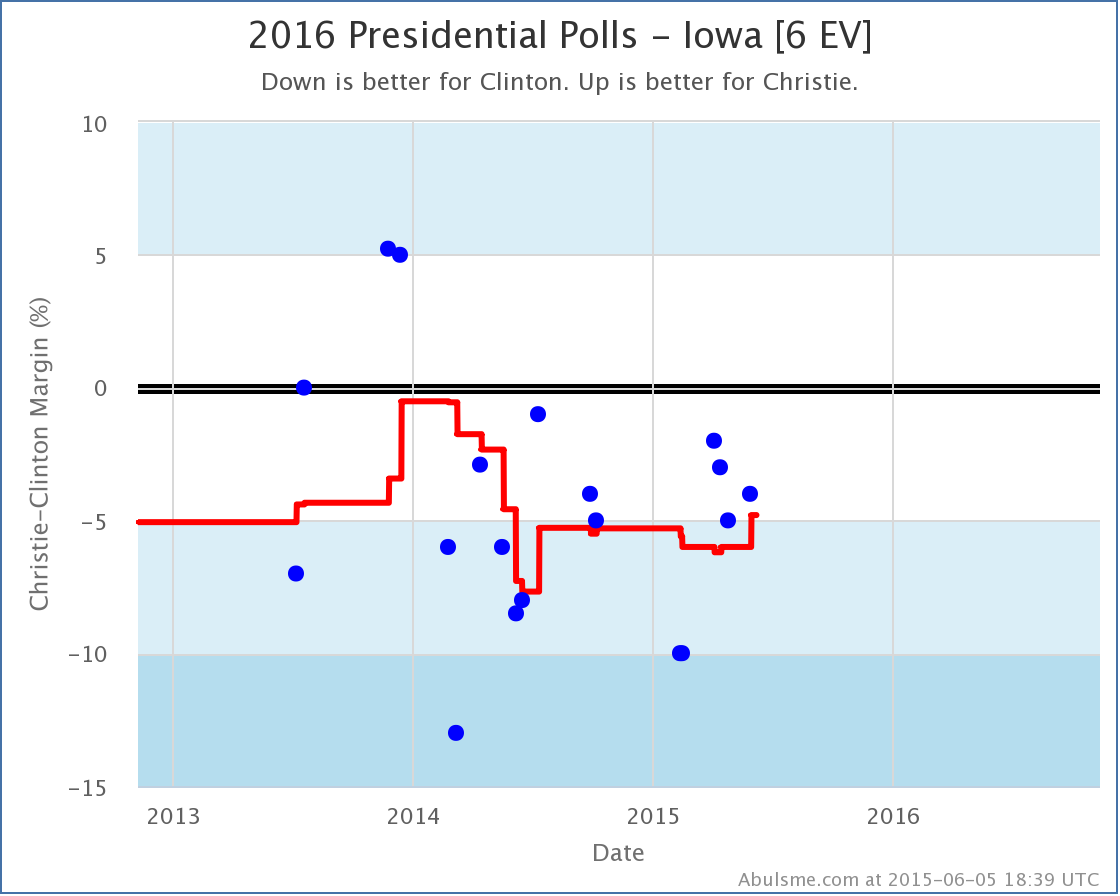
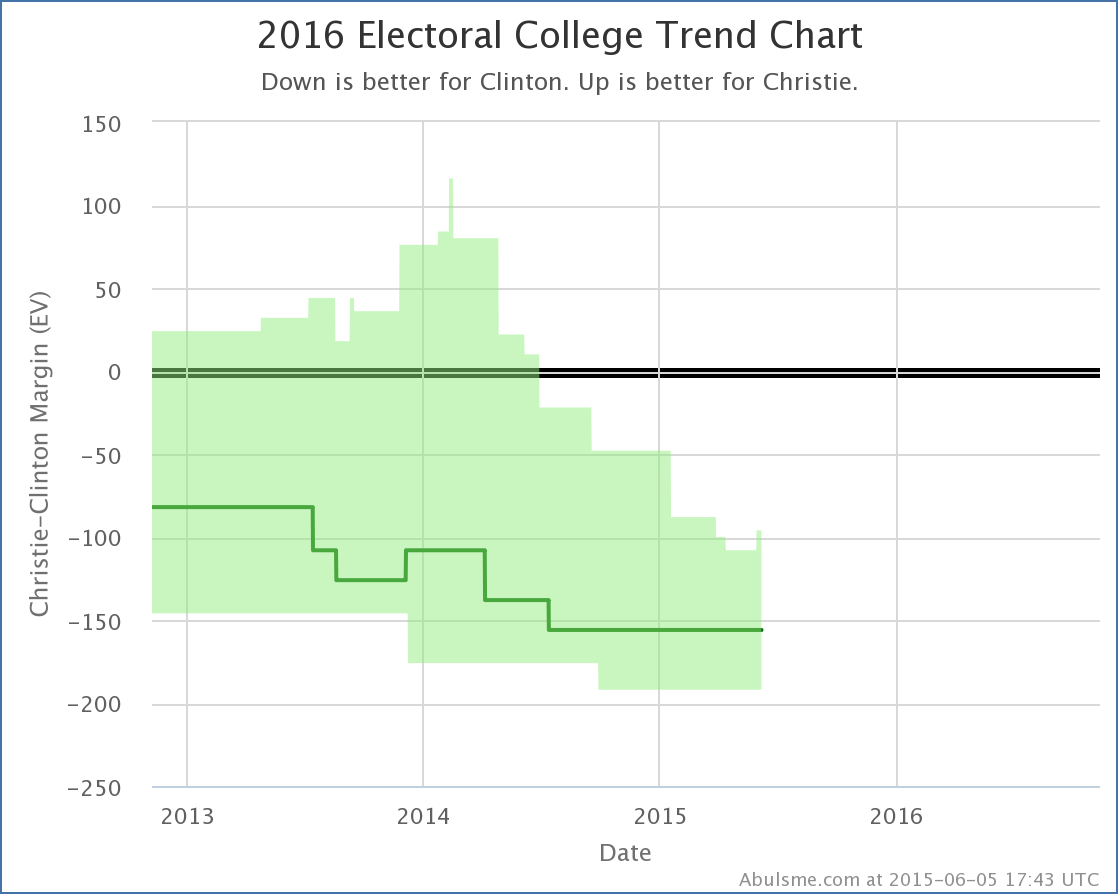
With the latest poll, the poll average for Clinton vs Christie in Iowa show’s Clinton’s lead below 5% for the first time since almost exactly a year ago. A 4.8% lead is still nothing to sneeze at, but it is close enough that we now allow for the possibility of Christie winning Iowa in our range of reasonably possible outcomes, so Christie’s “best case” improves:
That bump in the top right of the green envelope is the improvement we’re talking about here. Christie’s best case is still a 96 electoral college loss to Clinton. Along with his tipping point improvement that I noted on Saturday though, this makes two moves in Christie’s direction in a week, so maybe there is some new momentum in his direction? Nah, probably not, right?
The Others
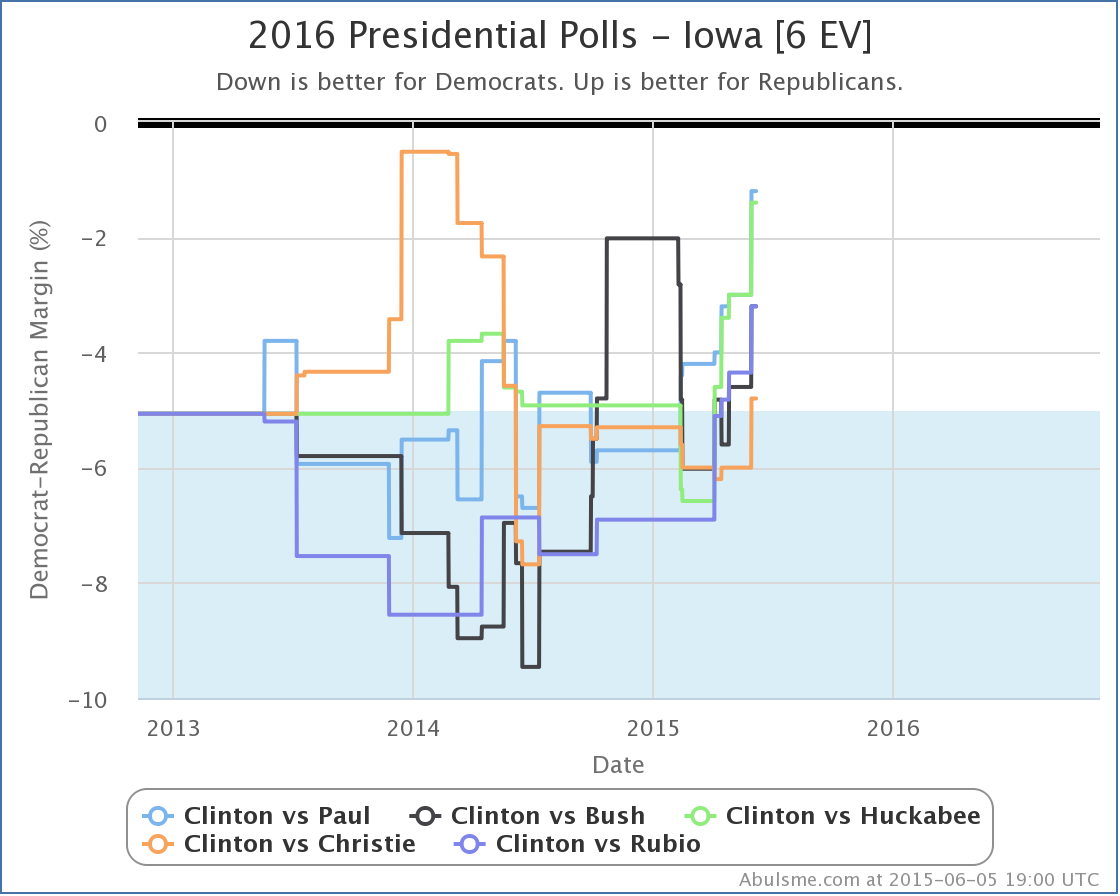
There may or may not be a specific move toward Christie, but lets look at the comparison chart in Iowa for all five of the “best polled” candidate combinations…
Hmm, definitely looks like some movement there in the last couple months.
Clinton’s lead seems to be evaporating in Iowa vs all five of these Republican challengers. But isn’t she spending all sorts of time in Iowa right now? Of course, Iowa gets attention due to the caucus of course, not an much for the general election, but still. This isn’t a good trend for Clinton.
There is no clear move like this on any of my national trend lines yet, but those take some time to move given that you need polling from a lot of states. But Iowa is one of the most polled states, so this could be a warning sign for Clinton’s broader situation.
522 days until the polls start closing. Plenty of time for drama and movement. Stay tuned!
Note: This post is an update based on the data on my 2016 Electoral College Analysis Site. All of the charts and graphs seen here are from that site. Graphs, charts and raw data can be found there for the race nationally and in each state for every candidate combination that has been polled at the state level. In addition, comparisons of the best polled candidate combinations both nationally and each in each state are available. All charts above are clickable to go to the current version of the detail page the chart is from, which may contain more up to date information than the snapshots on this page, which were current as of the time of this post.
Leave a Reply
You must be logged in to post a comment.