- 03:57:29 Poll Added: SurveyUSA in NC from 2015-04-22 to 2015-04-27 – Clinton 47% to Cruz 42% http://t.co/jjsiWHPGzv
- 03:59:27 Poll Added: SurveyUSA in NC from 2015-04-22 to 2015-04-27 – Clinton 45% to Bush 43% http://t.co/Vd6rnB9sg0
- 04:01:10 Poll Added: SurveyUSA in NC from 2015-04-22 to 2015-04-27 – Clinton 47% to Paul 43% http://t.co/ZbuTiL63yE
- 04:17:55 Poll Added: SurveyUSA in NC from 2015-04-22 to 2015-04-27 – Clinton 46% to Rubio 41% http://t.co/fZysFfO7iK
- 04:20:03 Poll Added: SurveyUSA in NC from 2015-04-22 to 2015-04-27 – Clinton 48% to Walker 39% http://t.co/KVJsZ2cSMz
- 04:20:17 Clinton vs Walker state category change: NC has moved from Weak Walker to Weak Clinton http://t.co/KVJsZ2cSMz
- 04:28:50 Poll Added: Siena in NY from 2015-04-19 to 2015-04-23 – Clinton 59% to Rubio 30% http://t.co/bojzwgailH
- 04:30:45 Poll Added: Siena in NY from 2015-04-19 to 2015-04-23 – Clinton 58% to Paul 29% http://t.co/iqKuCHh1B6
- 04:32:22 Poll Added: Siena in NY from 2015-04-19 to 2015-04-23 – Clinton 54% to Christie 34% http://t.co/u3x3hdNn19
- 04:33:52 Poll Added: Siena in NY from 2015-04-19 to 2015-04-23 – Clinton 55% to Bush 32% http://t.co/qPtFZAPhRj
- 04:35:45 Poll Added: Siena in NY from 2015-04-19 to 2015-04-23 – Clinton 59% to Cruz 26% http://t.co/L6Jm0YCNi0
- 04:44:12 Poll Added: Elon in NC from 2015-04-20 to 2015-04-24 – Clinton 47.4% to Bush 44.0% http://t.co/QeNsxDxavt
- 04:50:59 Clinton vs Walker expected case changed: Clinton 332 to Walker 206 -> Clinton 347 to Walker 191 http://t.co/Hs3djyrxB4
- 05:04:43 Poll Added: CNU in VA from 2015-04-13 to 2015-04-24 – Clinton 46% to Bush 48% http://t.co/aNvtNUENKs
- 05:04:54 Clinton vs Bush state category change: VA has moved from Strong Clinton to Weak Clinton http://t.co/aNvtNUENKs
- 05:07:15 Poll Added: CNU in VA from 2015-04-13 to 2015-04-24 – Clinton 47% to Christie 45% http://t.co/pDbaLZassM
- 05:09:06 Poll Added: CNU in VA from 2015-04-13 to 2015-04-24 – Clinton 49% to Huckabee 46% http://t.co/u1bt2aONBl
- 05:11:56 Poll Added: CNU in VA from 2015-04-13 to 2015-04-24 – Clinton 49% to Paul 47% http://t.co/4JfSlIUNbb
- 05:16:41 Poll Added: CNU in VA from 2015-04-13 to 2015-04-24 – Clinton 49% to Rubio 45% http://t.co/l1Cltc2gXW
- 05:19:19 Poll Added: CNU in VA from 2015-04-13 to 2015-04-24 – Clinton 49% to Cruz 44% http://t.co/L9pLqYq9lj
- 05:20:59 Poll Added: CNU in VA from 2015-04-13 to 2015-04-24 – Clinton 48% to Walker 43% http://t.co/UaJvJqo9m2
- 05:26:03 Poll Added: Gravis in NH from 2015-04-21 to 2015-04-22 – Clinton 42% to Bush 42% http://t.co/MgOH2YjPO3
- 05:28:07 Poll Added: Gravis in NH from 2015-04-21 to 2015-04-22 – Clinton 44% to Walker 47% http://t.co/r6I0sKsKXK
- 05:32:02 Poll Added: Gravis in NH from 2015-04-21 to 2015-04-22 – Clinton 44% to Paul 45% http://t.co/26ITUjDvoE
- 05:33:53 Poll Added: Gravis in NH from 2015-04-21 to 2015-04-22 – Clinton 43% to Christie 41% http://t.co/ynPz1BtzA2
- 05:35:27 Bush best case vs Clinton has changed: Clinton 294 to Bush 244 -> Clinton 281 to Bush 257 http://t.co/bCWkHhUOaT
- 05:37:21 Poll Added: Gravis in NH from 2015-04-21 to 2015-04-22 – Clinton 45% to Rubio 44% http://t.co/WchJjG0H90
- 05:39:08 Poll Added: Gravis in NH from 2015-04-21 to 2015-04-22 – Clinton 47% to Cruz 44% http://t.co/8soZ5cvKI3
- 05:49:59 Clinton vs Paul tipping point change: Clinton by 8.4 in VA -> Clinton by 7.6 in OH http://t.co/LefNp2tgcq
- 05:53:28 Clinton vs Rubio tipping point change: Clinton by 7.4 in MN -> Clinton by 7.2 in VA http://t.co/dry75JsahJ
- 05:54:57 Clinton vs Walker tipping point change: Clinton by 6.6 in VA -> Clinton by 6.4 in VA http://t.co/qsflmjPnvl
- 09:45:57 [Blog Post] "Electoral College: Virginia moving away from Clinton" http://t.co/NIqJ4rbbm7
- 10:11:29 [Blog Post] "Curmudgeon’s Corner: All Rockets Do" http://t.co/zq2itdJ2a3
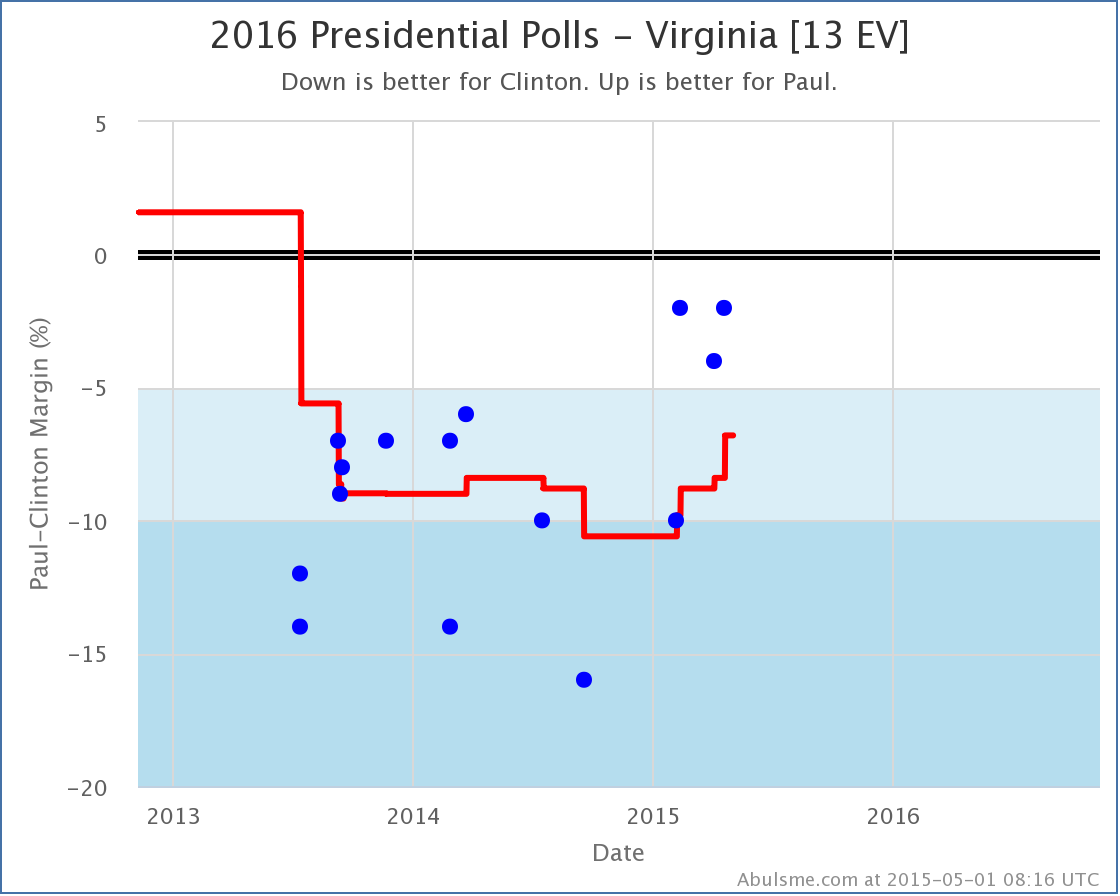
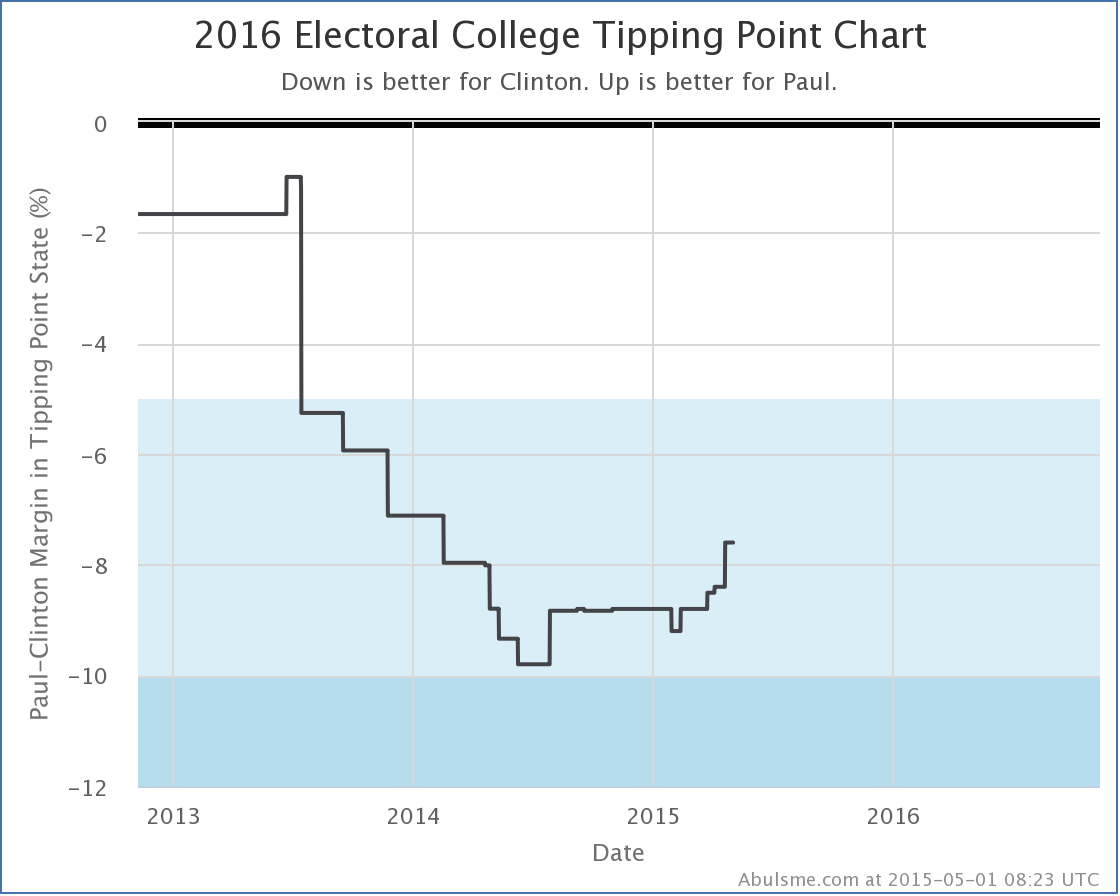
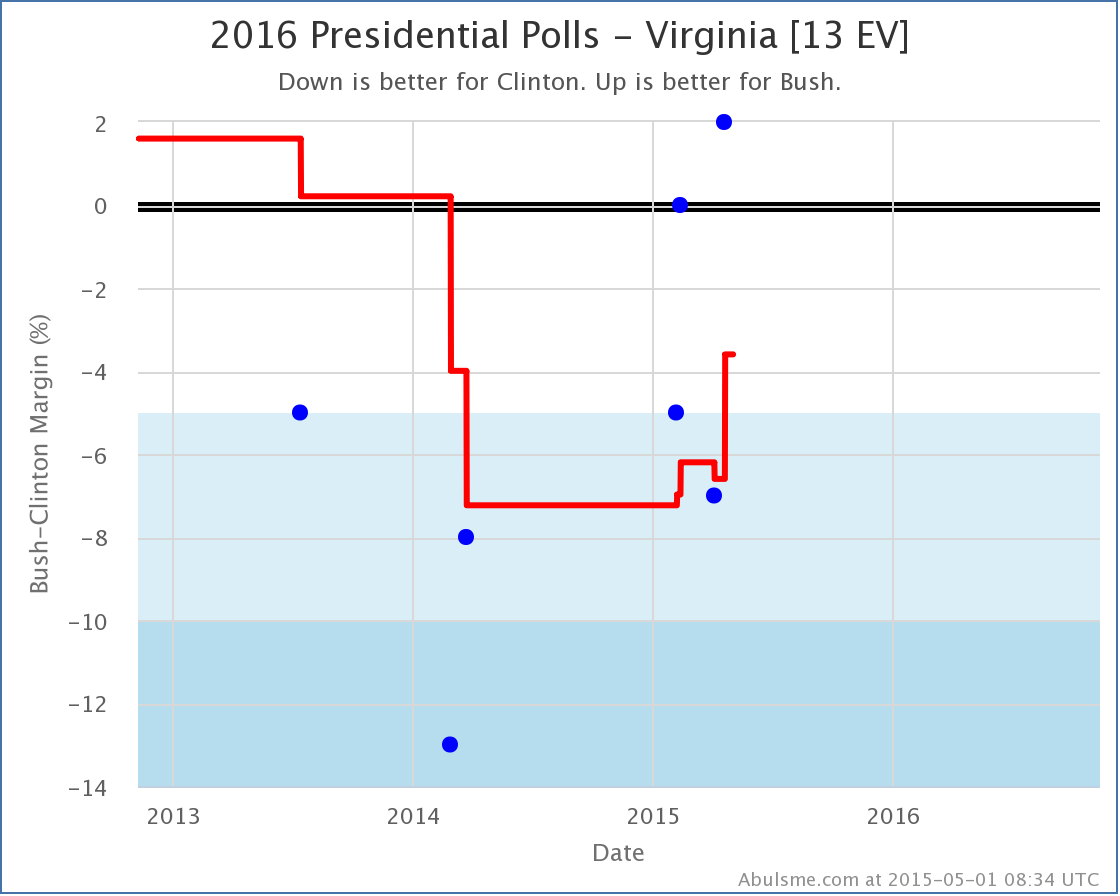
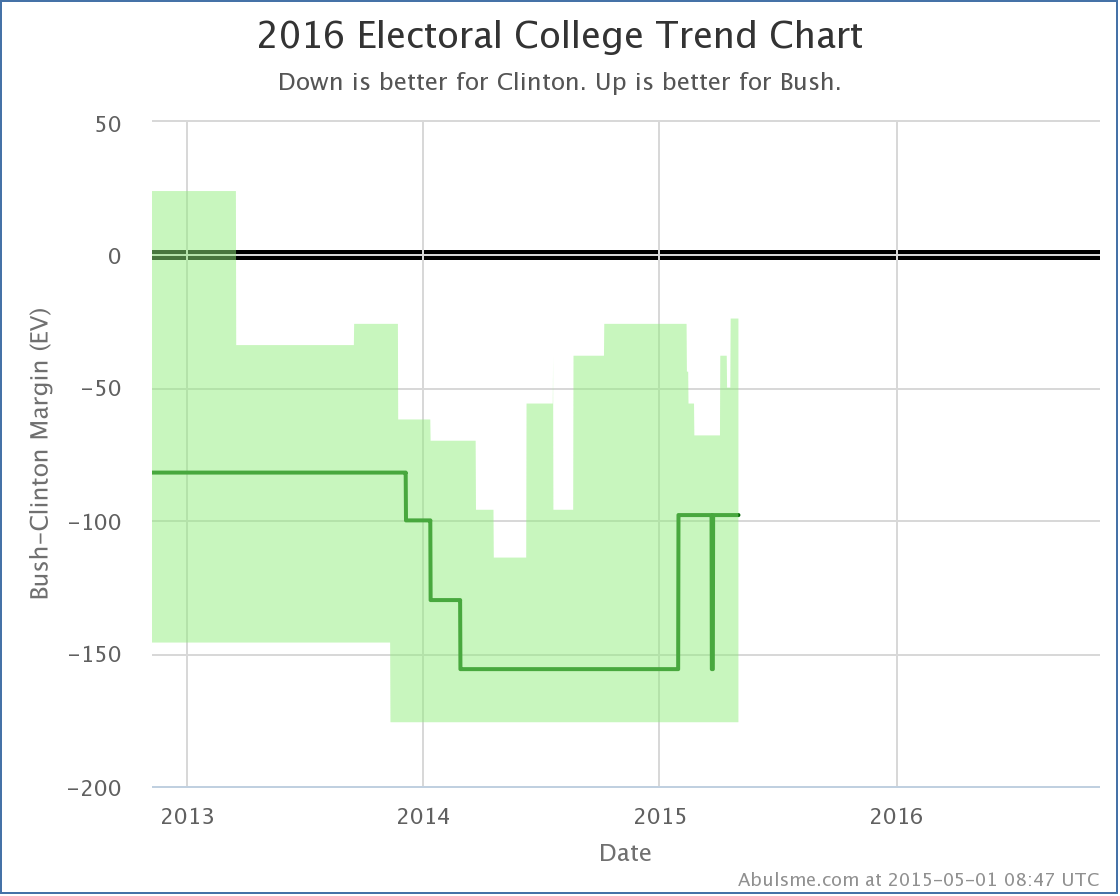
I added a bunch of new polls today, catching up after being preoccupied with something else the last few days. The first thing to note is a change to the “top five best polled” candidate pairs. With the latest batch of polling, a well polled state (North Carolina) that had been really close in Clinton vs Walker became less close, and thus this combination slipped out of the top five, replaced by Clinton vs Ryan again. I expect this won’t last long, with one of Clinton vs Rubio, Clinton vs Cruz, or Clinton vs Walker once again jumping onto the top five very soon. Within the top five candidate combinations, there were two changes of note this time: Clinton vs Paul The latest polling in Virginia from CNU improves Paul’s situation in Virginia from losing by 8.4% to only losing by 6.8%. This does not change Virginia’s categorization as a “Strong Clinton” state, but since Virginia was the tipping point state, it moves that metric: With this the tipping point moves from Clinton leading in Virginia by 8.4% to Clinton leading by 7.6% in Ohio. This is a nice bump toward Paul. We’re still in “Strong Clinton” territory by this metric of course, but this continues a general trend of Paul’s tipping point against Clinton improving ever since last summer. Paul and Bush are the only two Republicans in the current five best polled combinations that can claim a positive trend against Clinton on this metric. Clinton vs Bush Once again it was the CNU Virginia poll making a difference. Clinton’s polling average lead vs Bush declines from 6.6% to 3.3% with this new poll. This moves Virginia from “Strong Clinton” to “Weak Clinton” and puts it back in play for Bush and improves his “best case” (which is where I give him not just the states he is ahead in, but all the states where Clinton is ahead by less than 5%): This brings Bush’s best case to losing to Clinton by only 24 electoral votes. This is the best best case Bush has had since there was any real significant polling on 2016. Bush is currently doing better against than the other four Republicans in the five best polled combos in every metric I’m tracking. If he can make at least another 12 electoral votes close… say perhaps Iowa (6 EV) and Minnesota (10 EV)… the two “Strong Clinton” states that are the weakest for Clinton at the moment… then for the first time since early 2013 (when polling data was still sparse and we were mainly relying on previous elections) we’ll have a real race, where the Republican is actually in contention. Others Normally I wouldn’t mention combinations not in the top five, but since Clinton vs Walker just fell off with this update, I’ll briefly note that the news was mixed for him in today’s batch of polls. On the one hand, he improved in Virginia, which improved his tipping point. On the other hand, North Carolina flipped from Weak Walker to Weak Clinton, increasing the amount he would be expected to lose to Clinton by if each of them won all the states they were ahead in. Note: This post is an update based on the data on my 2016 Electoral College Analysis Site. All of the charts and graphs seen here are from that site. Graphs, charts and raw data can be found there for the race nationally and in each state for every candidate combination that has been polled at the state level. In addition, comparisons of the best polled candidate combinations both nationally and each in each state are available. All charts above are clickable to go to the current version of the detail page the chart is from, which may contain more up to date information than the snapshots on this page, which were current as of the time of this post.
|
||


