- 04:43:30 Poll Added: Dartmouth in NH from 2015-04-27 to 2015-04-30 – Clinton 36.5% to Christie 34.4% http://t.co/RiMTp5gqBu
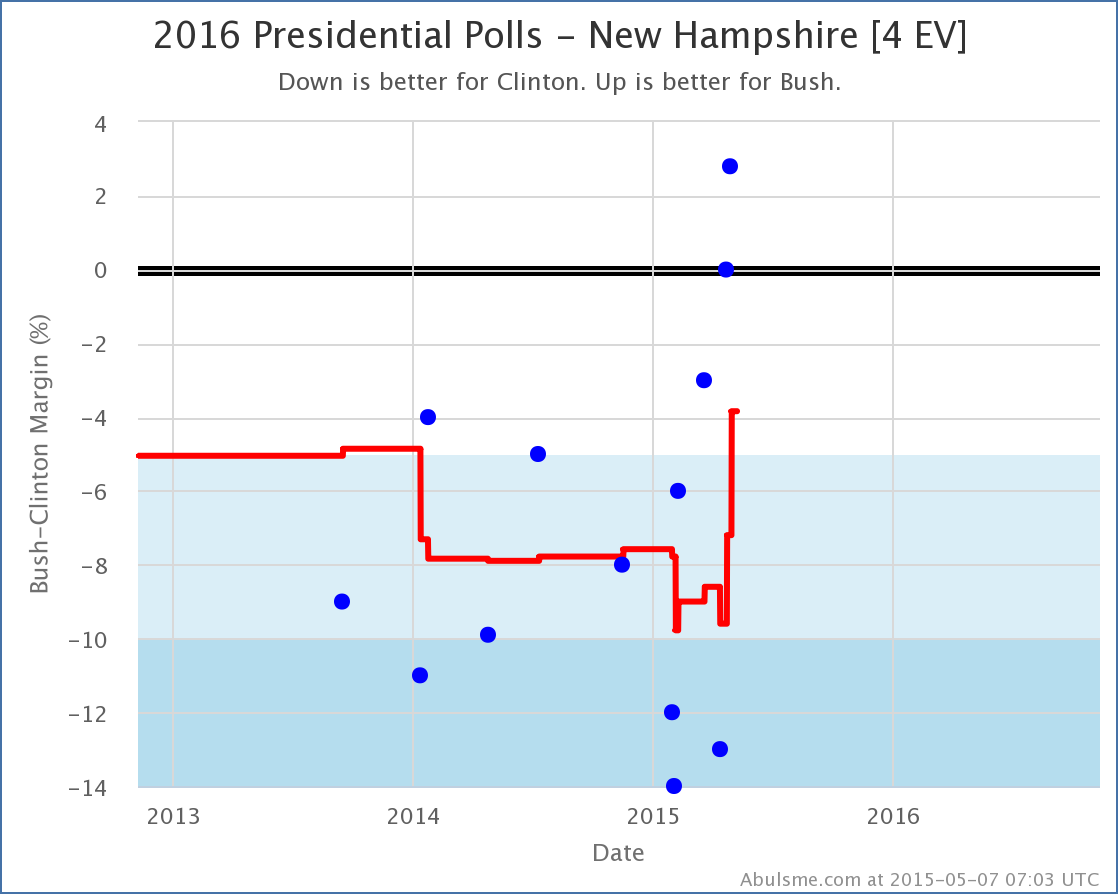
- 04:48:30 Poll Added: Dartmouth in NH from 2015-04-27 to 2015-04-30 – Clinton 34.1% to Bush 36.9% http://t.co/GS596Rs7lO
- 04:48:40 Clinton vs Bush state category change: NH has moved from Strong Clinton to Weak Clinton http://t.co/GS596Rs7lO
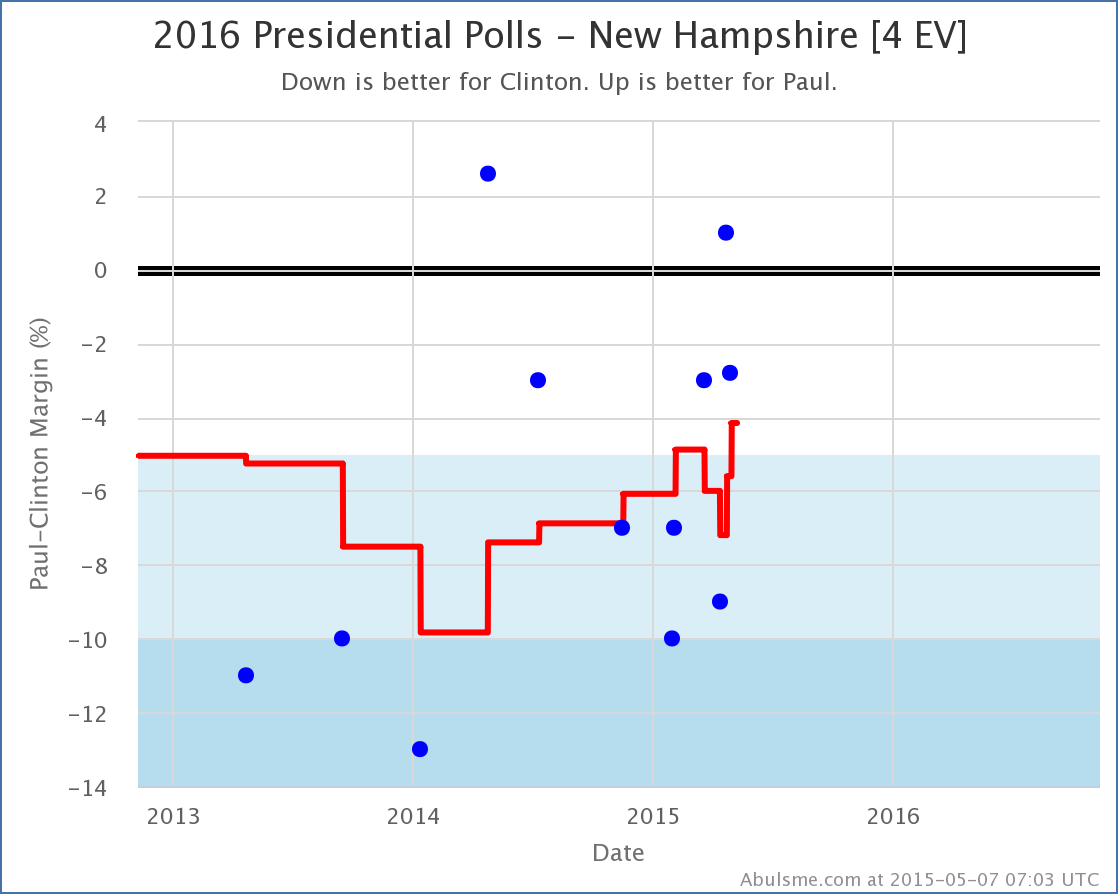
- 04:52:53 Poll Added: Dartmouth in NH from 2015-04-27 to 2015-04-30 – Clinton 36.1% to Paul 33.3% http://t.co/wn9qn3AF3N
- 04:53:30 Clinton vs Paul state category change: NH has moved from Strong Clinton to Weak Clinton http://t.co/wn9qn3AF3N
- 04:57:13 Poll Added: Dartmouth in NH from 2015-04-27 to 2015-04-30 – Clinton 38.1% to Huckabee 31.1% http://t.co/B3VWCBZqaV
- 05:00:23 Poll Added: Dartmouth in NH from 2015-04-27 to 2015-04-30 – Clinton 39.6% to Cruz 28.7% http://t.co/WcUrlTBrPn
- 05:03:18 Poll Added: Dartmouth in NH from 2015-04-27 to 2015-04-30 – Clinton 34.5% to Rubio 34.4% http://t.co/cwnXKgnD1n
- 05:08:02 Poll Added: Dartmouth in NH from 2015-04-27 to 2015-04-30 – Clinton 34.8% to Walker 38.7% http://t.co/IGNgxw1RuV
- 05:08:16 Clinton vs Walker state category change: NH has moved from Strong Clinton to Weak Clinton http://t.co/IGNgxw1RuV
- 05:18:32 Poll Added: PPP in AZ from 2015-05-01 to 2015-05-03 – Clinton 41% to Bush 41% http://t.co/XoS4zEqc9z
- 05:22:34 Poll Added: PPP in AZ from 2015-05-01 to 2015-05-03 – Clinton 42% to Carson 42% http://t.co/R9U0v35bw4
- 05:24:40 Poll Added: PPP in AZ from 2015-05-01 to 2015-05-03 – Clinton 39% to Christie 46% http://t.co/hglFuoAs91
- 05:26:51 Poll Added: PPP in AZ from 2015-05-01 to 2015-05-03 – Clinton 43% to Cruz 44% http://t.co/FuOogPJueG
- 05:28:54 Poll Added: PPP in AZ from 2015-05-01 to 2015-05-03 – Clinton 41% to Huckabee 44% http://t.co/RtCwXnOJVO
- 05:32:44 Poll Added: PPP in AZ from 2015-05-01 to 2015-05-03 – Clinton 40% to Paul 45% http://t.co/aTLGurrzQh
- 05:35:43 Poll Added: PPP in AZ from 2015-05-01 to 2015-05-03 – Clinton 44% to Perry 41% http://t.co/zHYoJzR1Hr
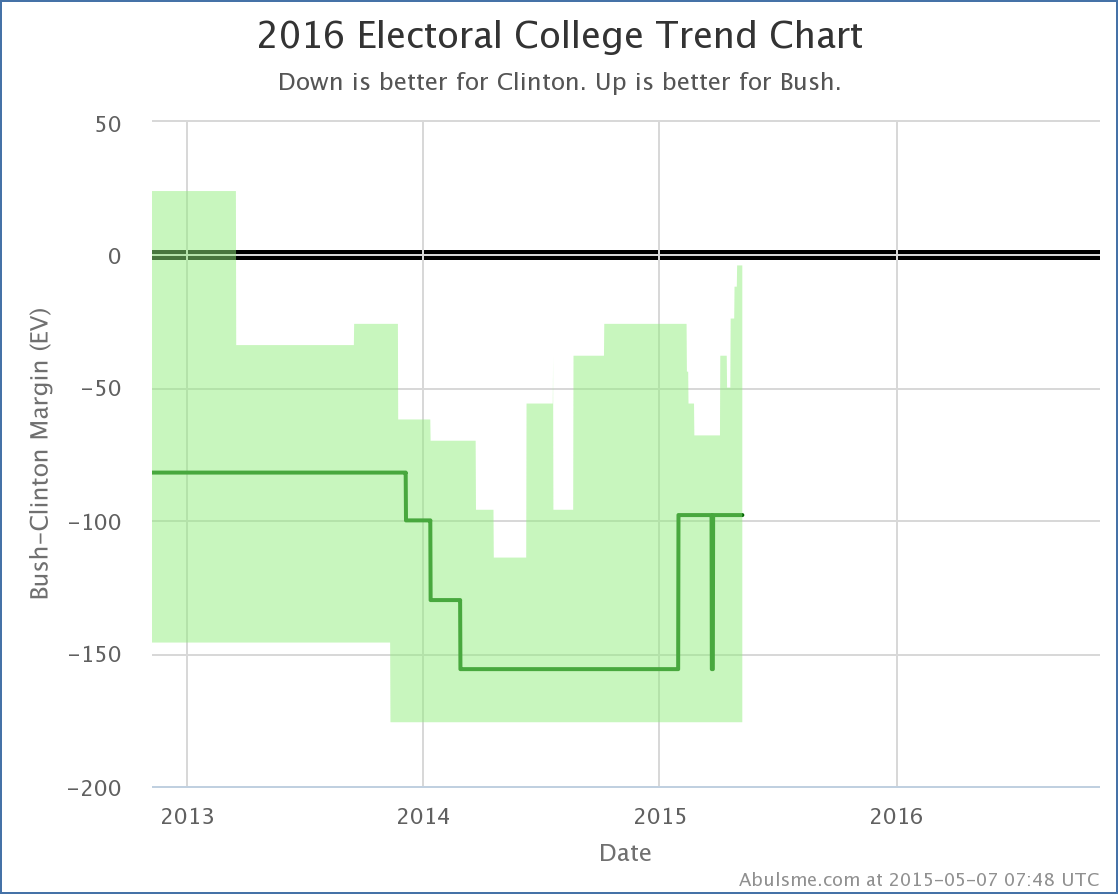
- 05:36:30 Bush best case vs Clinton has changed: Clinton 275 to Bush 263 -> Clinton 271 to Bush 267 http://t.co/VfnN3eze8h
- 05:53:11 Poll Added: PPP in AZ from 2015-05-01 to 2015-05-03 – Clinton 41% to Rubio 43% http://t.co/6MRFh5HAGH
- 05:55:33 Poll Added: PPP in AZ from 2015-05-01 to 2015-05-03 – Clinton 43% to Walker 44% http://t.co/eg9hh4xbJf
- 05:58:01 Poll Added: PPP in AZ from 2015-05-01 to 2015-05-03 – Chafee 26% to Walker 41% http://t.co/9S5B0lZfGx
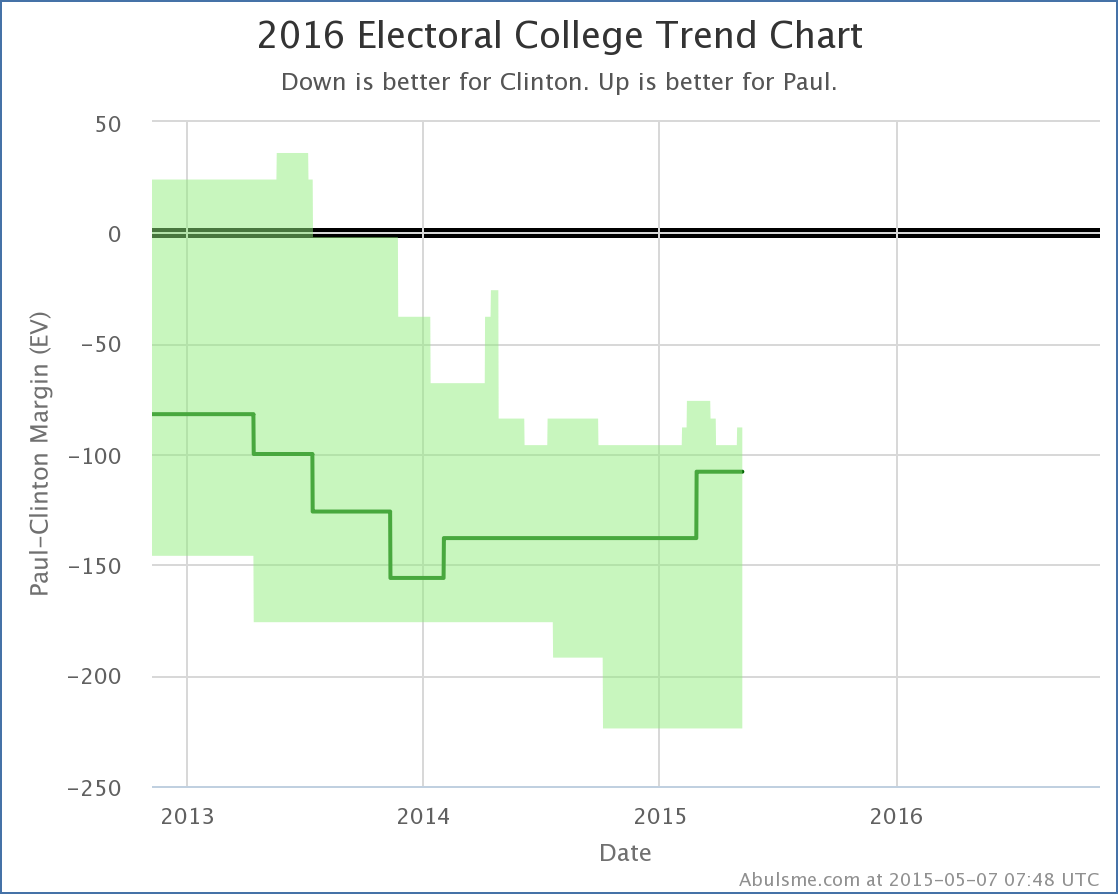
- 05:58:50 Paul best case vs Clinton has changed: Clinton 317 to Paul 221 -> Clinton 313 to Paul 225 http://t.co/qLOIqwfzAB
- 06:00:54 Poll Added: PPP in AZ from 2015-05-01 to 2015-05-03 – O'Malley 25% to Walker 43% http://t.co/drm2aDuxlE
- 06:01:14 O'Malley vs Walker state category change: AZ has moved from Strong Walker to Solid Walker http://t.co/drm2aDuxlE
- 06:03:16 Poll Added: PPP in AZ from 2015-05-01 to 2015-05-03 – Sanders 28% to Walker 43% http://t.co/Dj1qOM18GX
- 06:05:19 Poll Added: PPP in AZ from 2015-05-01 to 2015-05-03 – Webb 26% to Walker 44% http://t.co/9Usr0v4VLa
- 06:05:46 Webb vs Walker state category change: AZ has moved from Strong Walker to Solid Walker http://t.co/9Usr0v4VLa
- 06:09:17 Walker best case vs Clinton has changed: Clinton 305 to Walker 233 -> Clinton 301 to Walker 237 http://t.co/DNzVfjBY08
- 17:33:33 [Blog Post] "Electoral College: Clinton weakens in New Hampshire" http://t.co/stCxiAAycy
New polls added today. The ones that make a difference are new results from Dartmouth in New Hampshire. Specifically, two of our top five candidate pairs get status changes: Clinton vs Paul The latest polling once again moves New Hampshire into “Weak Clinton” territory. New Hampshire has been in and out of this category since the 2014 elections, but longer term trend here seems to be away from Clinton, so it is certainly possible New Hampshire will stay here for awhile, but it would also not be surprising if the state continues to bounce in and out of this category. For now, New Hampshire is back in play and improves Paul’s “best case”: New Hampshire is a little state. It is the little bump in the top right of the “realistically possible” bubble above. Paul’s best case is still a long way from winning. That is not not the case with Clinton vs Bush. Clinton vs Bush Bush’s improvement has been much more recent and sudden than Paul’s, so there is a greater chance this may just be a result of an outlier or two, and so it will be good to wait for confirmation from additional polls before thinking this is permanent, but for now, this is yet another state that has been moving Bushward… Look at that spike! At the beginning of April, Bush’s best case was to lose to Clinton by 68 electoral votes. In the weeks since, Clintons lead in my poll average has declined to less than 5% in several states and now Bush’s best case is to lose by only 4 electoral votes! Yes, yes, this is still a loss, and this is still only assuming Bush can flip all of the states where Clinton is ahead by less than 5%, but this is still a big move. Bush only has to move one more state from the current “Strong Clinton” category into the “Weak Clinton” category to make his best case actually be to WIN. Given current polling, the best candidates to try to reduce Clinton’s lead would be Minnesota (Clinton leads by 6.8%), Nevada (Clinton leads by 7.9%), Wisconsin (Clinton leads by 8.6%) or Ohio (Clinton leads by 9.2%). Making any one of those close would bring “Bush wins!” into the “possible bubble” for the first time since we’ve had any significant amount of 2016 polling. Of course, after that, to really win, Bush needs to actually start flipping some more states to his side as opposed to just making them close. But one thing at a time. Note: This post is an update based on the data on my 2016 Electoral College Analysis Site. All of the charts and graphs seen here are from that site. Graphs, charts and raw data can be found there for the race nationally and in each state for every candidate combination that has been polled at the state level. In addition, comparisons of the best polled candidate combinations both nationally and each in each state are available. All charts above are clickable to go to the current version of the detail page the chart is from, which may contain more up to date information than the snapshots on this page, which were current as of the time of this post.
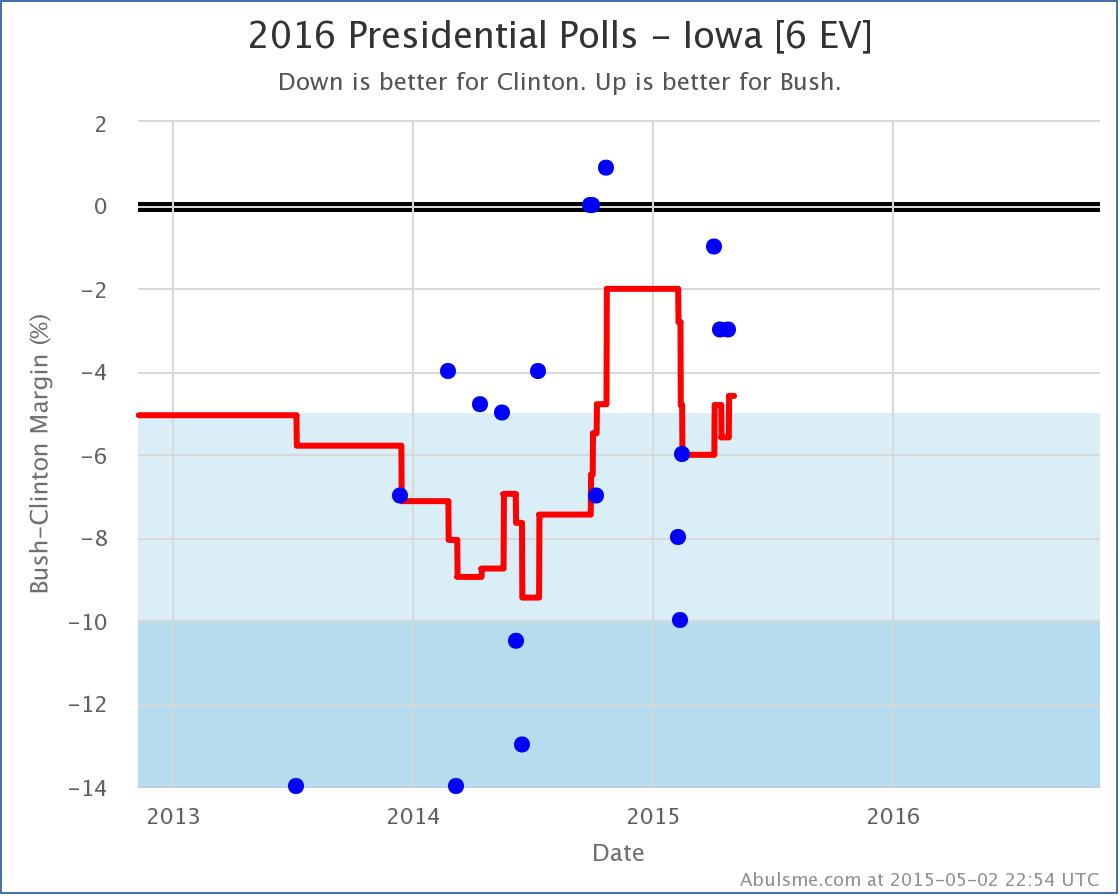
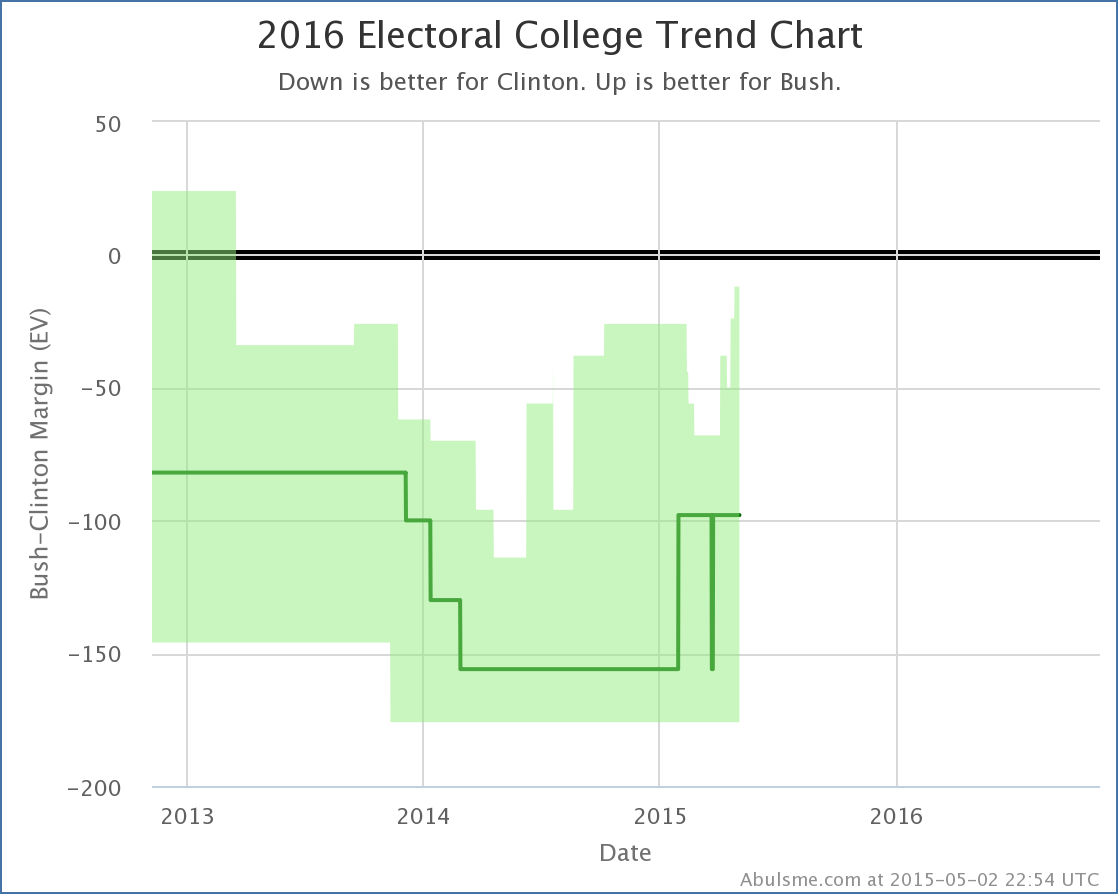
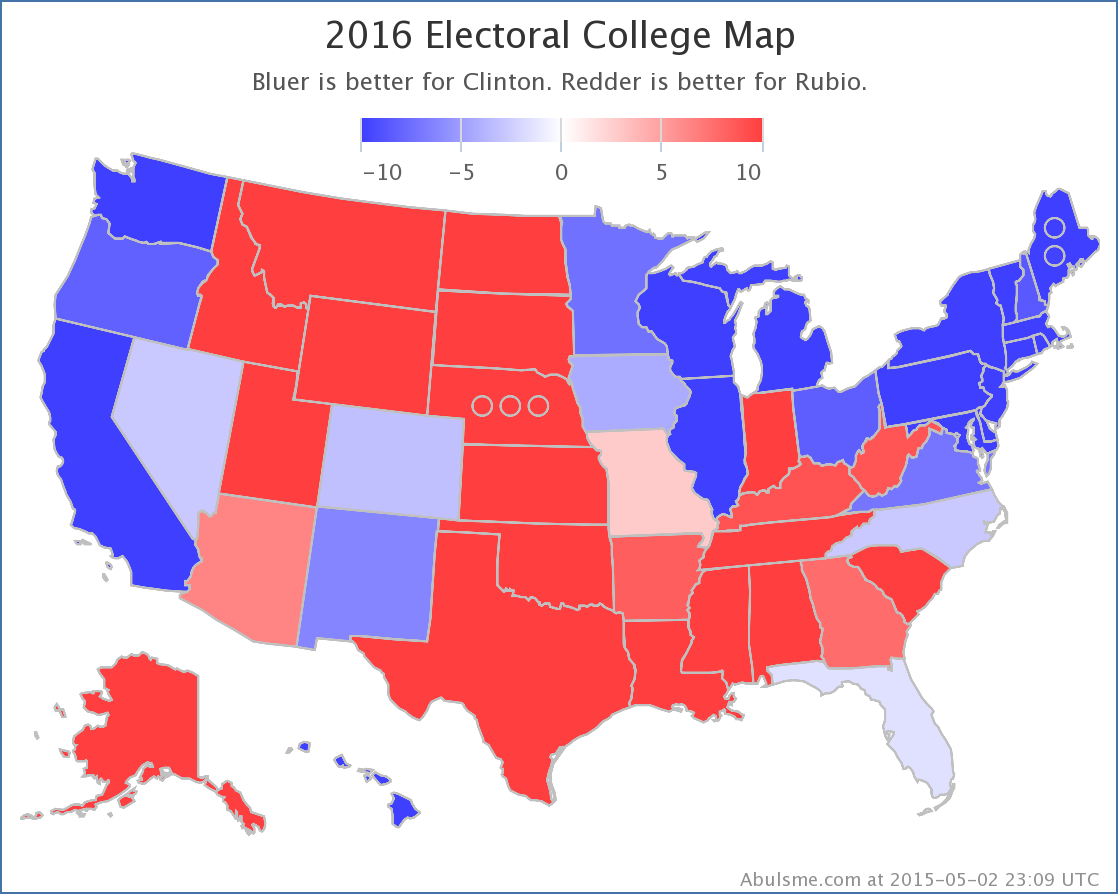
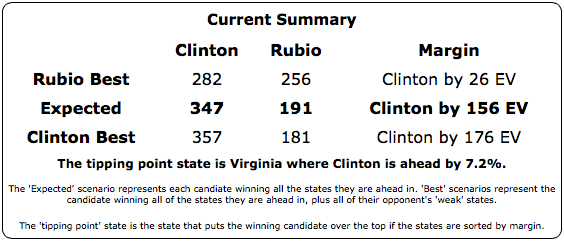
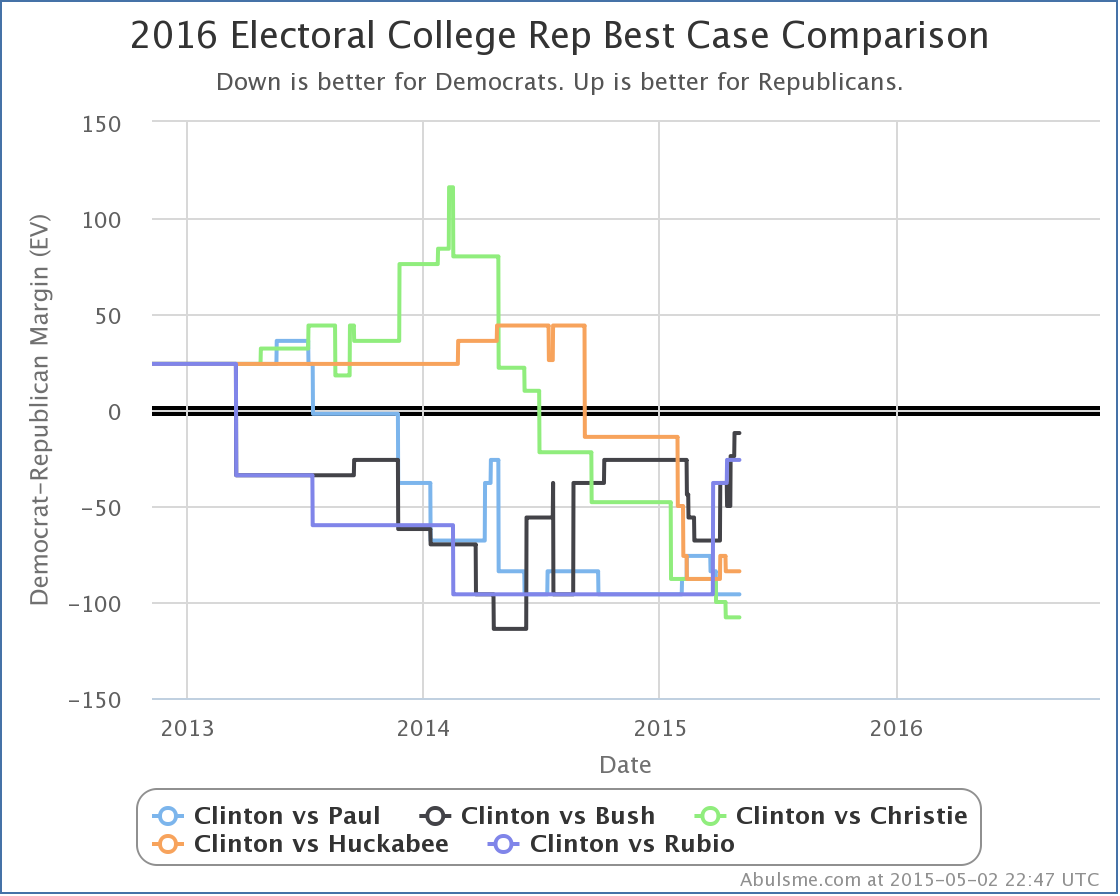
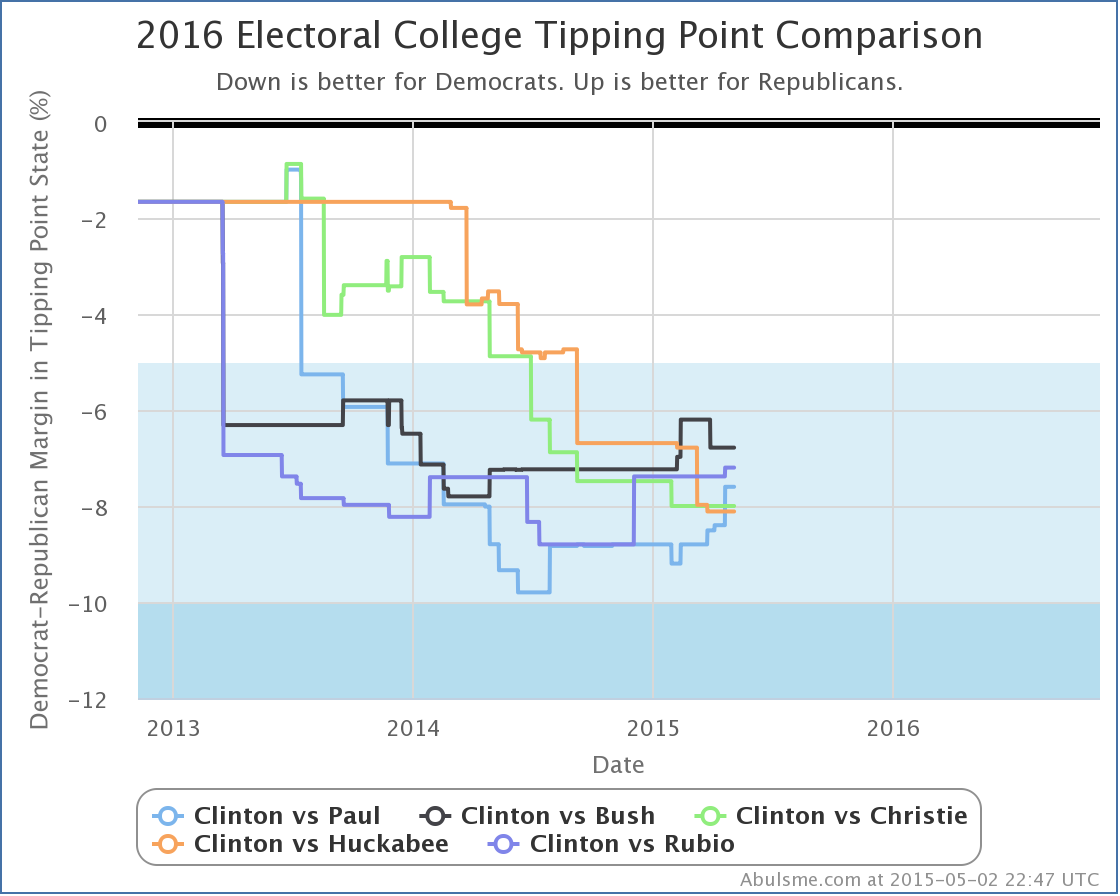
Just a new batch of PPP polls in Iowa today. Two changes worthy of note: Clinton vs Bush Bush vs Clinton has been bopping up and down across the Clinton leads by 5% line. The average is now once again on the “Weak Clinton” side of this line… and the trend in the last few months seems to be in that direction. With this, we mark Iowa as “possible” for Bush and include it in his best case: Why look there at that little peak stretching out over the past few weeks. This means that Bush’s best case is now to only lose by 12 electoral votes to Clinton. Bush only needs to get 6 more electoral votes worth of states to move into the “Weak Clinton” category to make his best case actually be to WIN. The best candidate right now is Minnesota (10 EV) where Clinton is ahead by 6.8%. (Minnesota also has only one Bush vs Clinton poll so far, and it was from October, so some new polling there is definitely needed… it may actually already be close, we just don’t have the polling to see it yet.) Will this Bush surge in his “best case” continue? Will it start being followed by increases in his “expected case” as well? As usual, we await more polls to find out… Clinton vs Rubio The other major thing to come out of today’s polls, is that for the first time Clinton vs Rubio joins the “top five best polled candidate combinations” that I actively blog about, knocking off Clinton vs Ryan which hasn’t had new polling since Ryan announced he wasn’t going to run. Since this combination is a new one for us to look at, rather than examining trends, lets look at the snapshot of where Clinton vs Rubio is right now: So, not winning against Clinton, just like all the other Republicans at the moment. But lets look at some comparisons with the other well polled Republicans. Since the Republicans are all losing right now, the “expected case” isn’t as interesting. Lets look instead at the Republican “best cases” and the tipping points: First the “best cases”. Rubio is second only to Bush (amongst the five best polled combinations) at how close things look if you give him all the close states. Bush loses by 12 electoral votes, Rubio loses by 26. (Going down the line, Huckabee loses by 84, Paul by 108, and Christie by 156.) This is all in the best case of course, the case where the Republican holds all of the states they are ahead in and also flips all the states where Clinton is ahead by less than 5%. A less than 5% lead is a slim on that can go away pretty quickly, or be wiped out by polling error, so this is an important metric to look at. But if we want to look at “how far does the candidate have to move the polls to win” that is what the tipping point is all about, so moving on to that: All five of the candidates here end up in “Strong Clinton” territory at the moment. Rubio is again doing second best of these five Republicans against Clinton. Clinton leads Bush by 6.8%, Rubio by 7.2%, Paul by 7.6%, Christie by 8.0%, and Huckabee by 8.1%. Within this comparison, Rubio doesn’t do all that badly against the field. It’s just that none of them are doing all that great. Of course, this is the time to remind everybody that even though an 8% lead sounds huge, it means that only 4% of the voting public… or 1 person out of 25, needs to change their mind in order to flip the election. (Or the undecideds have to break solidly in favor of the challenger, or turnout heavily favors the challenger, etc.) Now, the American electorate is very strongly polarized right now. But is it that hard to imagine 1 out of 25 people changing their minds if a big scandal hits Clinton and sticks? Or the economy goes south before the election? Nope. It isn’t. This far out, anything can still happen. Views like this show where things stand NOW, not where they will be in 556 days. Note: This post is an update based on the data on my 2016 Electoral College Analysis Site. All of the charts and graphs seen here are from that site. Graphs, charts and raw data can be found there for the race nationally and in each state for every candidate combination that has been polled at the state level. In addition, comparisons of the best polled candidate combinations both nationally and each in each state are available. All charts above are clickable to go to the current version of the detail page the chart is from, which may contain more up to date information than the snapshots on this page, which were current as of the time of this post. |
||
