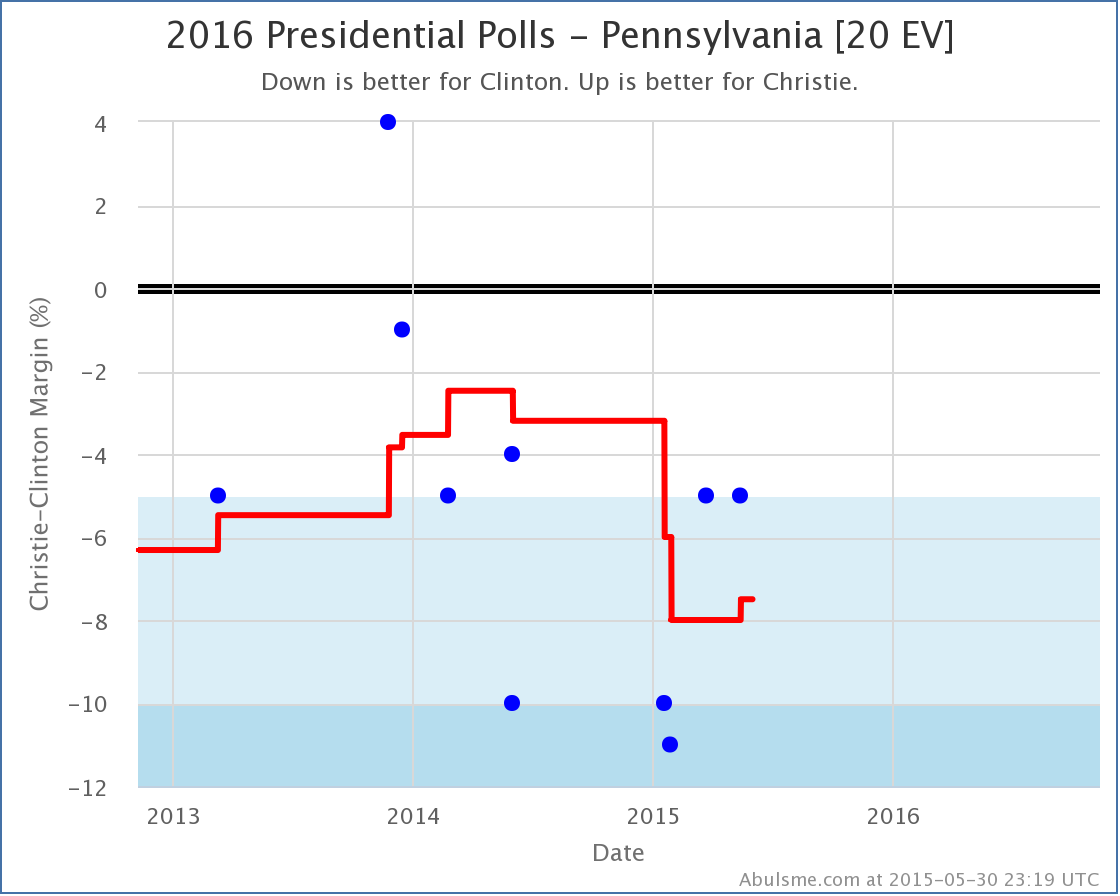
I added some recent results from PPP in Pennsylvania today. PPP polled 13 candidate combinations. Of these only one resulted in a change worth noting in one of our top five best polled candidate combinations. (I consider it a change worth noting if the expected electoral result changes, or the “best case” of one of the two candidates changes, or the tipping point changes.)
Clinton vs Christie
The polling average (which actually contains 6 polls right now rather than the usual five since there is a tie for fifth oldest poll by middate) still shows Clinton with a “Strong” lead, but slightly less of a lead than before. The state doesn’t change categories though, it isn’t close to a “Weak Clinton” state. But it turns out that in Clinton vs Christie, Pennsylvania was the tipping point state, so the topping point changes.
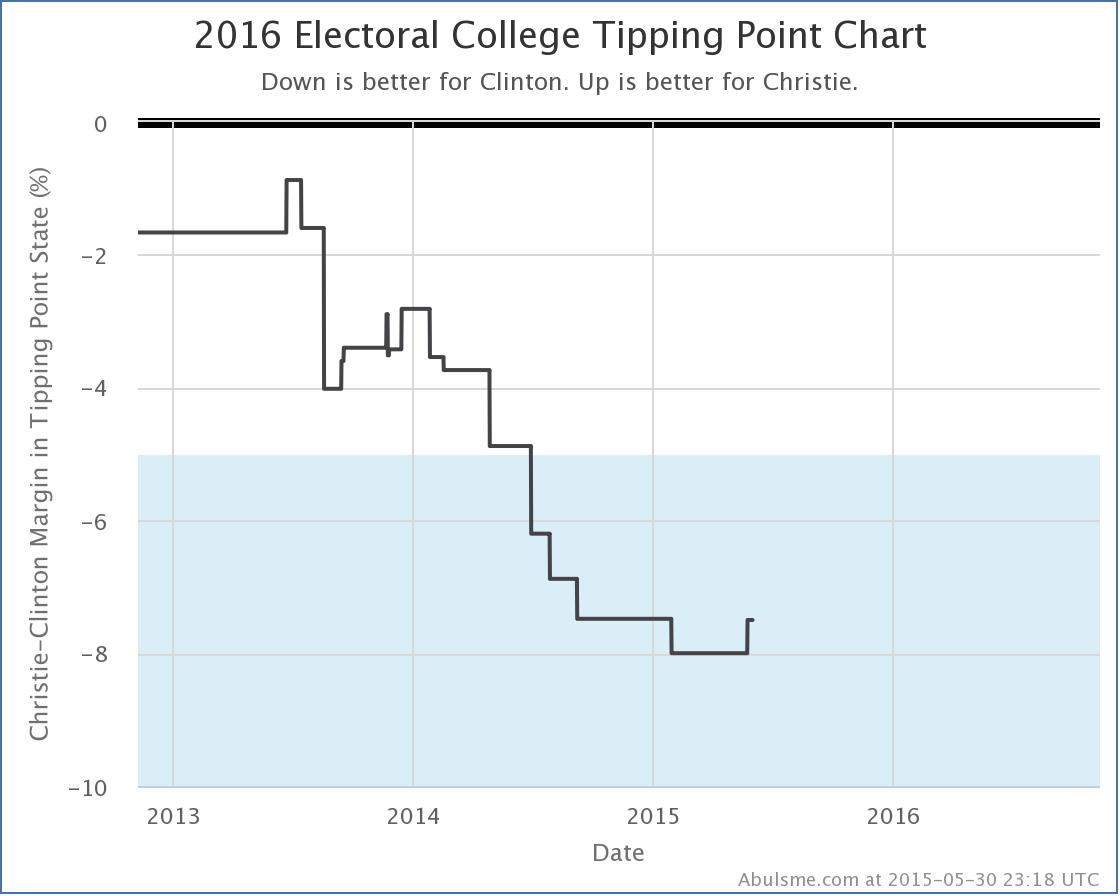
For those who don’t remember, the tipping point is determined by sorting the states by the support level of the candidates, and then seeing which state is the one that would put the winning candidate over the edge. By then looking at the margin in that state, you see how far ahead polls would have to swing on a national basis to change the outcome of the election. In other words, this is a bit like looking at national popular vote numbers, but taking into account the structure of the electoral college. More than most of the other numbers I look at, this represents how far ahead (or behind) a candidate is.
In this case, the tipping point was Pennsylvania, where Clinton was ahead by 8.0%. With the new poll added, the tipping point is still Pennsylvania, but Clinton’s lead is down to 7.5%.
This is the first improvement for Christie in ANY of the metrics I track for Clinton vs Christie since February of last year. Is this the sign of a resurgence for Christie? I kind of doubt it. That ship may have sailed. But it may represent him getting to the point where he won’t get any lower.
The Others
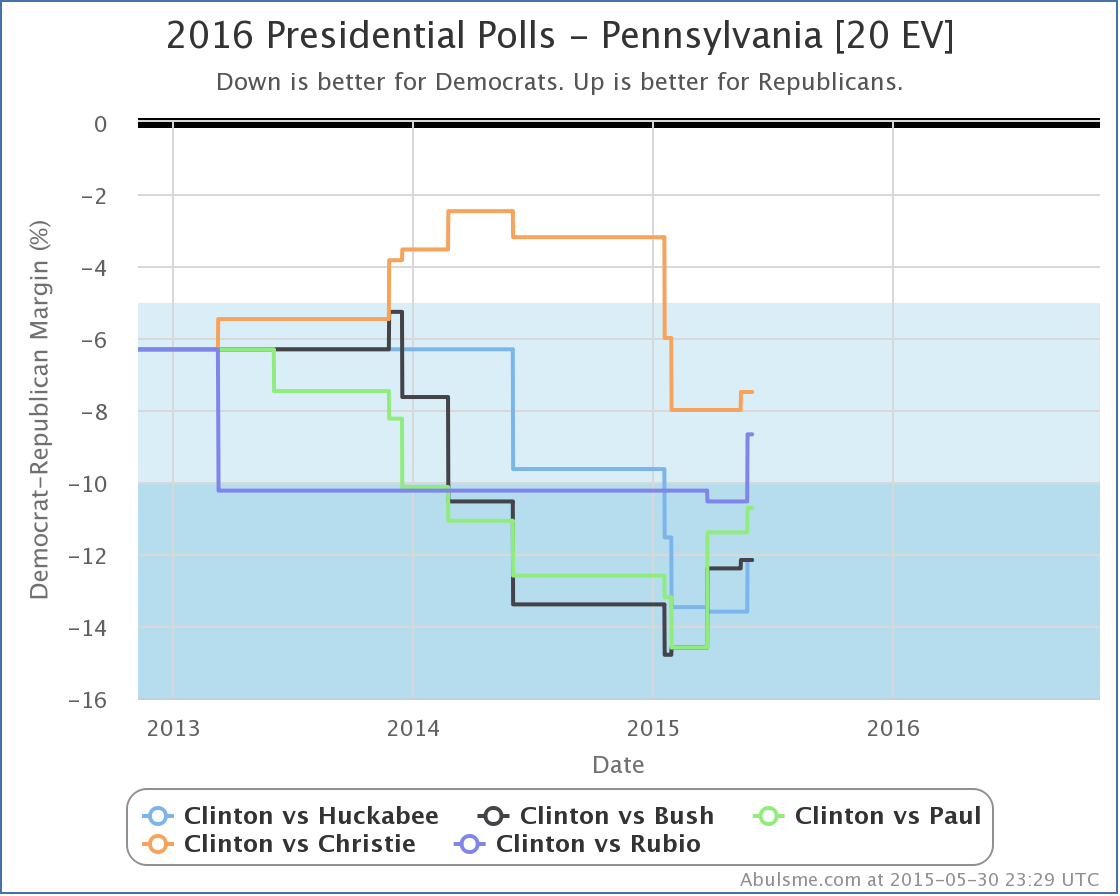
It is worth looking at how some of the other candidates are doing in Pennsylvania though. Here are the Pennsylvania trends for the five best polled candidate combinations at the moment:
With Christie now enjoying an upward tick of his own, all five Republicans have been improving in Pennsylvania in the last month or so. Bush, Paul and Rubio are all better off than they were at the November elections as well. (Huckabee and Christie are still down from where they were at that point despite the bump in the last month.)
Some of the most recent individual polls in Pennsylvania actually have the state close for some of these candidates against Clinton, but the average isn’t there yet. It is showing movement though. So it is certainly possible we will see further polls confirm Pennsylvania getting closer. Pennsylvania is a big state (20 electoral votes). If Pennsylvania is in play, it opens up a lot more possibilities for the Republicans. So keep an eye on the polls here.
Note: This post is an update based on the data on my 2016 Electoral College Analysis Site. All of the charts and graphs seen here are from that site. Graphs, charts and raw data can be found there for the race nationally and in each state for every candidate combination that has been polled at the state level. In addition, comparisons of the best polled candidate combinations both nationally and each in each state are available. All charts above are clickable to go to the current version of the detail page the chart is from, which may contain more up to date information than the snapshots on this page, which were current as of the time of this post.


