|
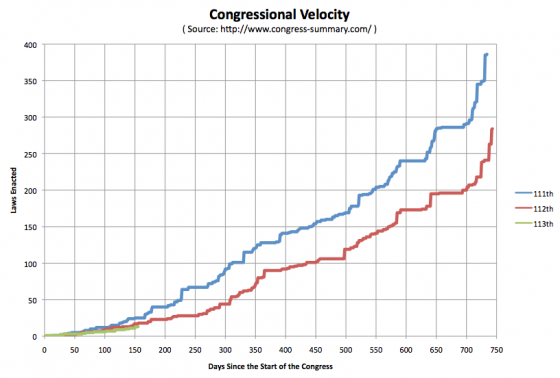
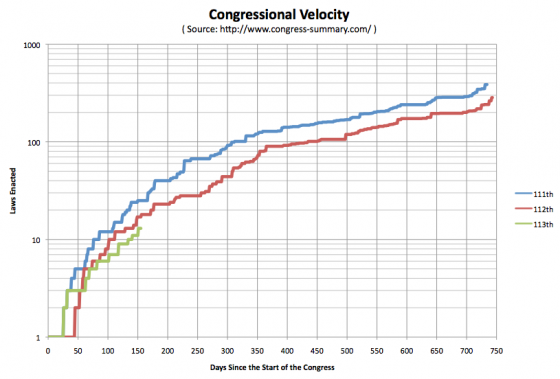
In our annual predictions show for 2013 one of the items Ivan and I disagreed on was if the 113th congress would enact laws at a higher or lower velocity than the 112th. (Enact of course meaning passed by both houses of Congress and signed by the President.) So I have started to track that. Here are the charts so far (one with a linear scale, one with a log scale to better show the early detail): Minus any new laws recently signed that might not have made it to my source at congress-summary.com yet, as of 155 days into each of the three Congresses (that would be June 7th of the first year in all three cases) we have the 111th having 25 laws enacted, the 112th having 17 laws enacted, and the 113th having 13 laws enacted. It is interesting to note the somewhat similar patterns in the shapes of the curves, indicating that although the velocity may be different, there seems to be a nice pattern to how Congress ramps up, when it takes breaks, when it speeds up and does more, etc. Bursts around holidays and in the lame duck period, lulls during the summer, bigger lull in the run up to elections, etc. (Of course, to really examine this, you’d need to look at more than 3 congresses, the similarities may not bear out with robust scrutiny.) So far I am correct in my prediction that the 113th would enact fewer laws than the 112th. But there is still plenty of time before the end of the year for this to change and for Ivan to be proven right instead. At the moment I am not making any statement on if that is a good or a bad thing. :-)
|
||


