|
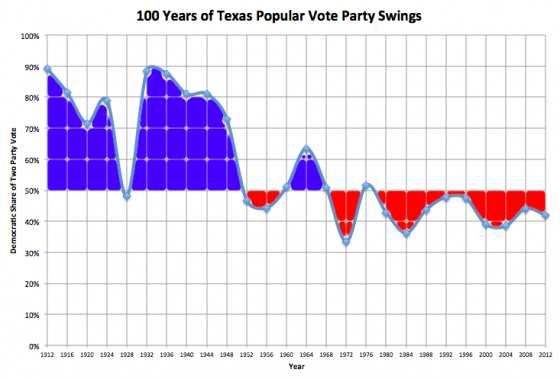
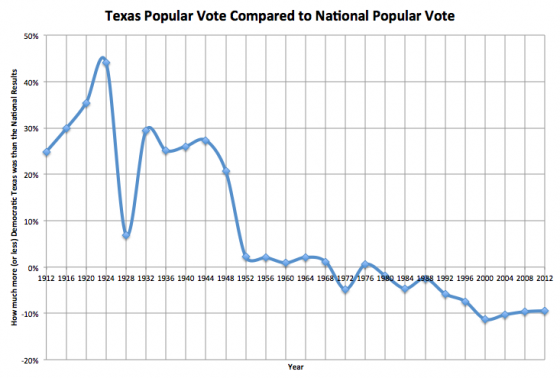
Earlier this week, Andrew Sullivan had a series of posts exploring trends in Texas that may eventually make it a swing state. (Part 1, Part 2, Part 3) This prompted me to wonder what the actual numbers were and what the trend might look like. Demographic trends may well cause changes in the electoral balance in Texas at some point in the future, but looking at actual historical election results shows no such trend so far. Similar to the chart I did of national trends on Sunday, the chart above shows the Democratic proportion of the two party vote (ignoring third parties) over the last 100 years, this time just for Texas. Over this timescale, clearly the trend is from a very reliable Democratic state prior to 1950 to a solid Republican state since 1970. Looking just since 1970, one could argue that the trend is fairly flat, but if you look at how winning Democratic presidents have done, you see that Clinton did not match Carter’s numbers (Carter actually won Texas in 1976) and then Obama has not matched Clinton’s numbers. Each winning Democratic president has done worse in Texas than the one before. Now, one could say that Obama did better in Texas than Kerry or Gore, and that would be quite true. But it seems like that is more just a factor of being a winning candidate, and thus having higher levels of support overall. And in the most recent timeframe you can look at, Obama 2012 didn’t do as well as Obama 2008. There may be underlying demographic trends that will eventually favor Democrats in Texas, but they haven’t actually started to bend the curve there quite yet. But wait! There is another way of looking at this! I hinted at it when I mentioned that the winning Democratic candidates (Obama, Clinton, Carter) got a boost compared to the losing Democratic candidates (Kerry, Gore, Dukakis, Mondale) just by virtue of being winners. You can correct for this by looking at how Texas voted relative to the national vote rather than just looking at Texas in isolation. If you take the Democratic percentage of the two party vote in Texas, and subtract from that the Democratic percentage of the two party vote nationwide, you get a measure of how much more (or less) Democratic Texas is than the country at large. With this, you get the following chart: I’ve left out the red and blue coloring this time because it clutters up the image, but this chart is a lot less noisy. You still see a very clear trend with Texas becoming less Democratic and more Republican over the last 100 years (compared to the rest of the country). In this view however you CAN see an inflection point at the 2000 election. Up until 2000 Texas was clearly getting more Republican (compared to the rest of the country) with almost every election. Then that trend seems to stop. In 2000 Texas was 11.2% more Republican than the nation.* Each election since then the difference between Texas and the national average has been slightly less. In 2004 Texas was 10.3% more Republican. In 2008 it was 9.6%. And in 2012 the preliminary numbers have it at 9.4%. At that rate Texas still has a LONG time to go until it is really close to the national numbers. But with this view, you actually do see a trend with Texas’s Republican lean (relative to the rest of the country) decreasing slightly over the past few elections. * I’m being slightly sloppy with language here, to be more correct I would say that the Democratic proportion of the 2 party vote was 11.2% less in Texas than the Democratic proportion of the 2 party vote nationwide. Note: Data from uselectionatlas.org.
|
||


