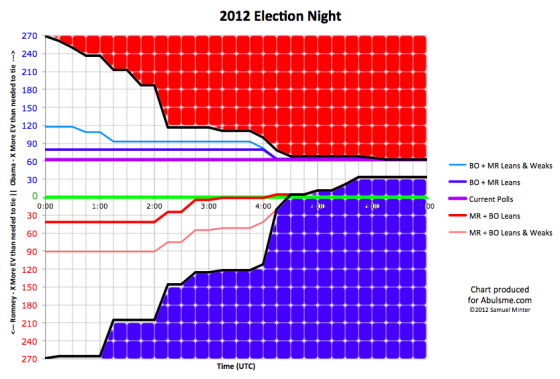
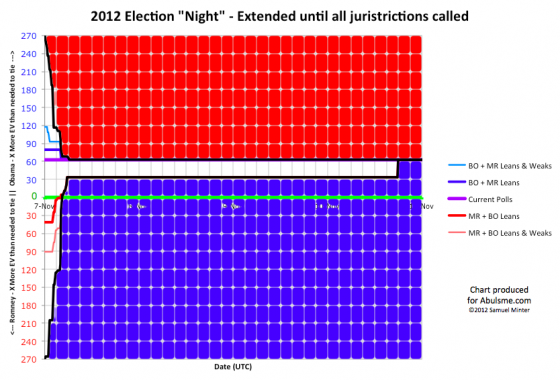
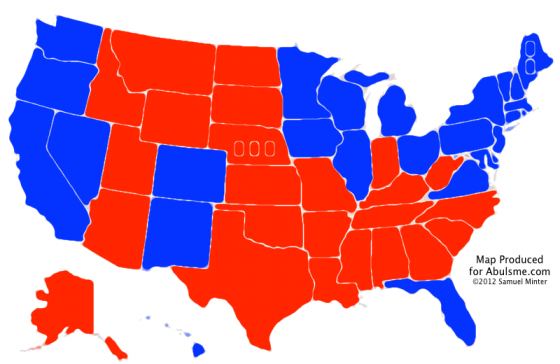
Just before 18:00 UTC today, Florida was finally “called” for Obama. Absent any faithless electors, this makes the final electoral college results Obama 332, Romney 206.
As those of you following my electoral college tracking this year know, not only was that the final state of my “Current” line on election day, but it is also by far the most common location of the race in the daily updates covering the whole year. As I’d said quite a few times, 332-206 just seemed to be where this race “wanted” to be. Sometimes events would move the polls slightly further in Obama’s direction, sometimes slightly further in Romney’s direction, but 332-206 seemed to attract the race like a magnet, and things would revert back to this state. When things “reverted to the mean” this is where they went.
Also of course, looking at the daily updates going back to January, Romney was NEVER ahead in this electoral college analysis… or any other electoral college analysis. Aside from a few days in October where Romney was threatening to take the lead (but never did) the question was never if Obama would win, but rather by how much. But yet reports are that the Romney campaign, and Romney himself, were shocked by the fact that they lost. They really truly did not believe the overwhelming consensus from the pollsters.
I guess to some degree to run a national campaign like this you HAVE to make yourself think you are winning, but still…
One final point. There are quite a few more complicated models out there doing electoral college analysis. They provide potentially more detail and more kinds of insight than mine, but part of my point in doing this exercise is that even a very simple “last five poll” average can get you very good results. The marginal value from added complexity doesn’t really seem to get you that much more. This isn’t to say that there isn’t value in that complexity. There is. And if I had more time, I’d certainly be tempted to make a more complex method of analysis myself.
But the simple average still got 56 out of 56 right. (That would be the 50 states plus DC, plus the congressional districts in Maine and Nebraska.)
That ain’t bad.
Note added Nov 11 00:25 UTC: I have some final clean up to do on it yet, but the archival wiki page with all the information from this general election season is here. The earlier wiki archiving the primary season is here.
Edit Nov 11 00:34 to change some awkward wording.


