This was supposed to be a day where not much would happen in the polls, the campaign is after all over, right? But my final scan of the polls showed a flurry of polls moving things toward Obama in some key states. Now, a lot of these last polls are internet tracking polls, which some folks question and don’t include in their averages at all. But I have always included them.
As usual, I’ll start by looking at the three states changing status today, and then we’ll take one final look at all the swing states.
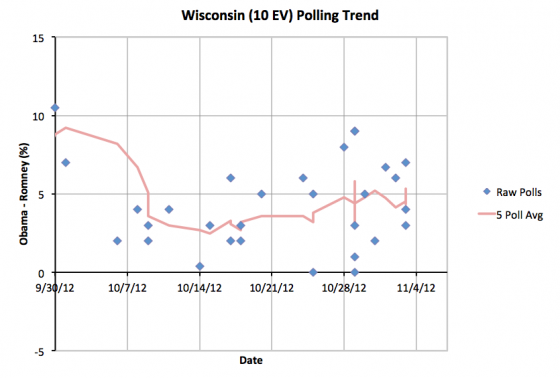
For most of the last month Wisconsin has seen an Obama lead of less than 5%. A new poll with a 7% lead for Obama gets added in my last update, and pushes the five poll average up above 5% to 5.3%. So Wisconsin gets pulled out of the list of states that Romney could even conceivably win. There won’t have been a 5% move in the last day or two, and even if the polls were very wrong, they won’t be THAT far wrong.
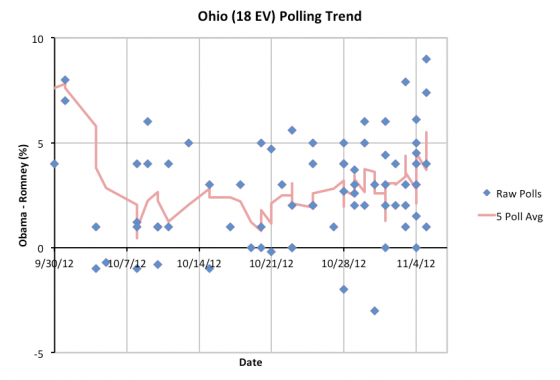
Ohio, Ohio, Ohio! All the talk the last few weeks (if not most of the last few months) has been about Ohio. But look at that trend. After bottoming in the middle part of October… a bottom which by the way was still a lead… Obama has been gaining ground day after day for the last two and a half weeks. Today there were a couple of new polls showing Obama with really big leads in Ohio. Those MIGHT be outliers. We’ll know when the votes are counted. But with or without those new polls today, the trend is undeniable. Obama has been ahead in Ohio all along, and the last few weeks has been increasing his lead.
Perhaps Romney’s decision to throw resources into Pennsylvania and Michigan reflect the fact he knew he had already lost Ohio. There are still ways to win without Ohio, but they are much harder.
Ohio had been on one of Romney’s best paths to victory. It seems to have slipped away. With today’s update the five poll average jumps to a 5.5% Obama lead. I no longer include the possibility of Romney winning Ohio in his best case.
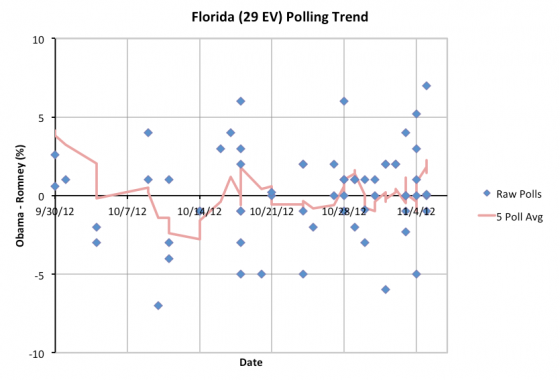
Florida has been bouncing back and forth. I have said each time that it was essentially too close to call, and we would know who wins once the votes are counted. Today I added some new polls, some of which show a substantial Obama lead. As with Ohio, these MAY be outliers. But they do look like possible movement. The five poll average not only goes above the line, but actually jumps to the highest point it has been since the 1st debate… up to a 2.3% Obama advantage. This might… MIGHT… actually represent real movement.
By my five poll averages, Florida is now the second closest state. (The first is North Carolina, where Romney only holds a 1.4% lead.) So it could go either way. It EASILY could. But right now, at the very end, the polls seem to give the advantage to Obama.
The votes start getting counted in the eastern part of Florida in less than two hours. I guess we’ll know soon enough.
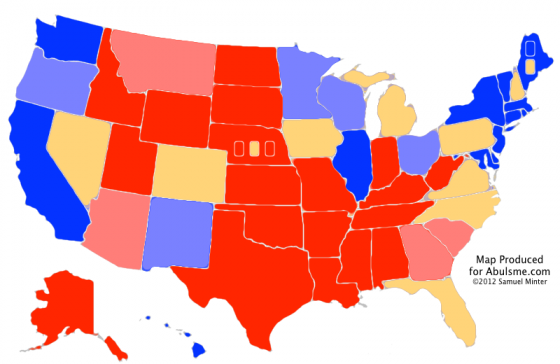
But, Florida flipping at the very last moment to Lean Obama, even if it really is still too close to call, does make me smile, because when we look at the map and summary…
| Romney | Obama | |
|---|---|---|
| Romney Best Case | 310 | 228 |
| Current Status | 206 | 332 |
| Obama Best Case | 190 | 348 |
YES! That is right, 332-206 is back! As I tweeted a little while ago, “It is as if months and months of campaigning on both sides changed absolutely nothing…”
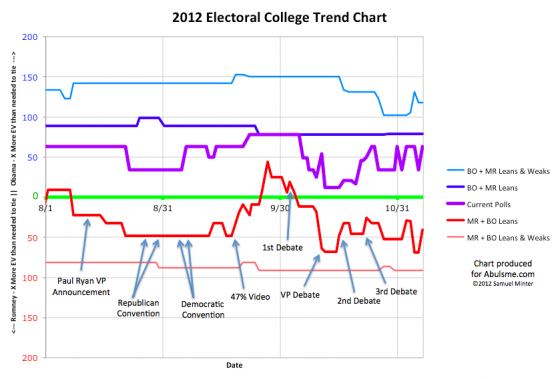
All year long, the “Current Status” of my five poll average has bounced around, but it has always returned to an Obama victory with a 332-206 margin. It has been like a magnet. It is as if this is where this race has “wanted” to be. This is the natural location of public opinion at the moment, with events temporarily pushing things one way or another, but this being the “normal” state that things return to.
Now, a few of the states are close. Nine states and two congressional districts have margins less than 5% at the moment. Four states have margins less than 2.5%. That would be North Carolina, Florida, Colorado and Iowa. If we see deviations from the “Current Status” those are the four states most likely to flip. And they very well might.
But time is running out, so let me jump to the summary of the close states as they stand in my five poll average today.
With the areas he is ahead by more than 5% in, Romney starts out at 190 electoral votes. Then we have the areas he is ahead in:
- Nebraska 2nd (1): 3.8% Romney lead
- North Carolina (15): 1.4% Romney lead
That gets Romney to 206 electoral votes. That is still 63 electoral votes short! So let’s start pulling in states in order of how far behind Romney is (and therefore how likely he is to flip them):
- Iowa (6): 2.0% Obama lead
- Florida (29): 2.3% Obama lead
- Colorado (9): 2.4% Obama lead
- New Hampshire (4): 2.8% Obama lead
- Maine 2nd (1): 2.8% Obama lead
- Virginia (13): 3.6% Obama lead
- Michigan (16): 4.5% Obama lead
Now, if Romney does win Michigan, he can then afford to lose Virginia and Maine’s 2nd. So the “easiest” path to victory for Romney is now to keep Nebraska’s 2nd and North Carolina, then pull out wins in Iowa, Florida, Colorado, New Hampshire and Michigan.
But Romney is behind by 4.5% in Michigan right now. That looks like an incredibly unlikely outline unless all the polls are not just wrong, but outrageously wrong.
If Romney fails to get Michigan, what’s left of the close states are:
- Pennsylvania (20): 4.8% Obama lead
- Nevada (6): 4.8% Obama lead
Not much there to work with, unless, again, the polls are all just completely wrong.
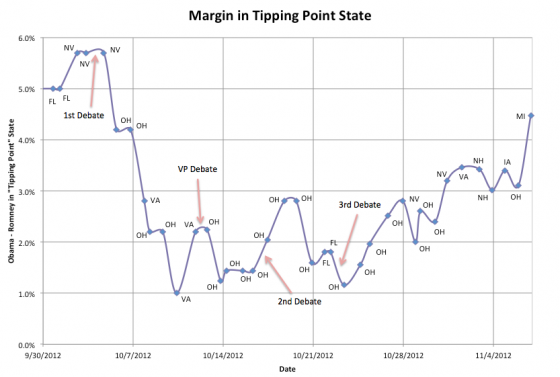
So one last look at the chart of the margin in the tipping point state (which is now Michigan):
The trend toward Obama is unambiguous. The election is over. Romney won’t “move the polls” now. Romney’s only hope is that the polls were just very very wrong. At this point, for Romney to be ahead, the polls have to be showing a consistent 4.5% bias toward Obama. Not just specific pollsters, but some sort of bias that affected all the pollsters, left right and center.
This seems incredibly unlikely.
We’ll see in a few hours of course. I’ll bet that the pollsters are right though. This is an Obama win. The only question is how late in the evening things go before that is obvious even to the people who don’t want to believe it.
As I type this, the first polls close in less than 15 minutes. Those are only parts of states. The first full polls close in just over an hour, at 0:00 UTC (7 PM Eastern, 4 PM Pacific). That batch of states includes Virginia, the first close state to start reporting results.
If Romney looks like he is winning Virginia, then his odds for winning go up considerably. If Romney is losing Virginia, as the polls would predict, then it will confirm that things are heading as expected toward an Obama victory.
People have asked me a few times for my actual prediction for the race. Technically speaking the way I have organized the models I show here, all it really says is that Obama is ahead, but Romney can still win if he sweeps all the close states.
But I think it should be obvious the result I am predicting. It has been showing up in my model all year long.
My prediction: Obama wins 332 to 206.
I won’t be surprised if some of North Carolina, Florida, Colorado and Iowa go differently than my five poll average. But 332 to 206 is my prediction at the moment. And Florida, Colorado and Iowa are not enough to change the results, so I predict an Obama victory regardless.
Now it is time to just sit back and wait for the returns to come in.
I will be here and posting updates for most of the evening. My wife does need to go to the airport tonight, but we don’t need to leave home until 10 PM Pacific (1 AM Eastern). I am guessing the result will be obvious by then.
Note: Chart and map from the Abulsme.com 2012 Electoral College Prediction page. Both assume Obama vs Romney with no strong third party candidate and show polling as it currently exists. Things will change before election day. On the map red is Romney, blue is Obama, gold states are too close to call. Lines on the chart represent how many more electoral votes a candidate would have than is needed to tie under several different scenarios. Up is good for Obama, Down is good for Romney.
