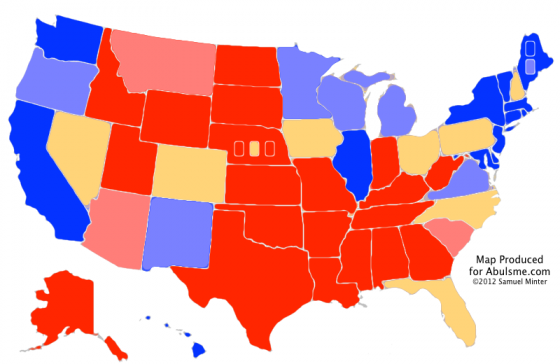
Today’s update includes Wisconsin, Virginia and Florida all changing categories, all moving in Obama’s direction. But two of these three states need to have asterisks next to the status change, and one of them needs a big asterisk. So lets look at them:
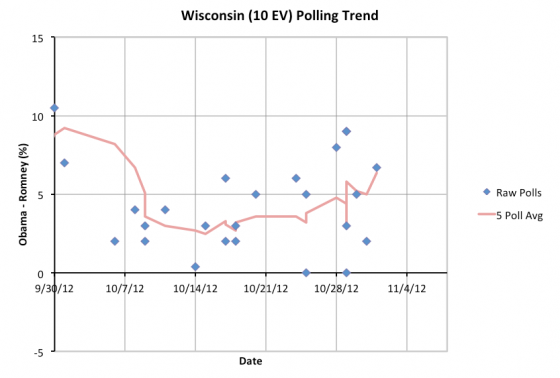
We’re looking only at the last few weeks in these state trend charts now since the election is so close and there is so much polling. Of the three states moving today, Wisconsin looks the most like a real bonafide movement. There is a lot of spread in the polls, but this looks like a real trend toward Obama over the last few weeks. The five poll average goes over 5% today, to 6.3%, so I take it out of the “Lean Obama” category where I consider Romney winning the state to be possible.
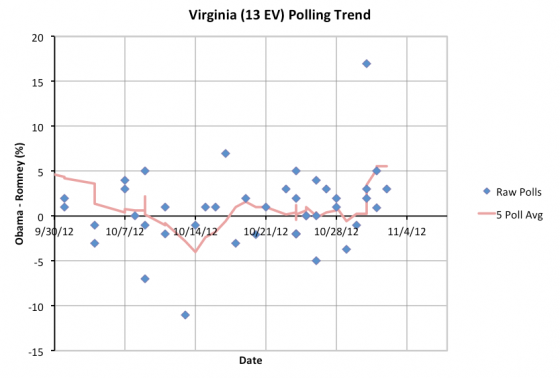
Virginia is the state that requires the big huge asterisk. As I mentioned yesterday, there is a big ugly outlier point currently in Virginia. According to the process I defined months ago, it gets included. I won’t second guess that process to remove it based on my own judgement rather than any hard or fast rule which was determined BEFORE seeing the data. (I may change the inclusion rules in 2016 though.) In any case, I will however point out that it is a pretty unbelievable outlier.
Even without this outlier, there is movement in the last week toward Virginia. But with the outlier included in the five poll average, Obama’s lead in the state jumps to 5.6% today, changing the state’s category. Without the outlier, Obama’s lead has still increased, but only to 2.8%. At the current rate of polling in Virginia, the outlier should roll off the average before the election, quite possibly tomorrow.
But for the moment, I list Virginia as “Weak Obama” and take it out of Romney’s best case.
But I really don’t believe it.
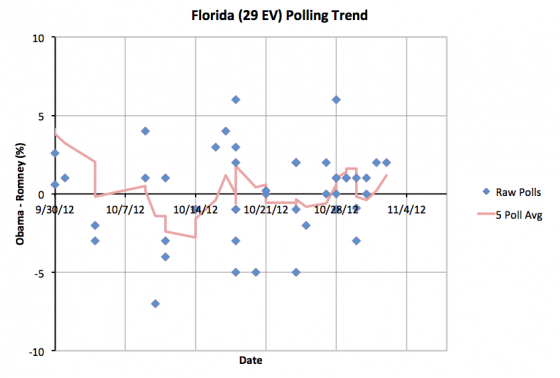
Finally Florida. This one just gets the asterisk because we essentially just have Florida continuing to bounce around right near zero. If you eliminate the two most extreme polls in the last two weeks (one favoring each candidate) there does appear to be a bit of a trend toward Obama. But the state is still really close, and may continue to bounce back and forth before we are done.
So the new summary and map:
| Romney | Obama | |
|---|---|---|
| Romney Best Case | 298 | 240 |
| Current Status | 206 | 332 |
| Obama Best Case | 190 | 348 |
So once again the “current status” is 332 to 206. It seems like we may have seen that before.
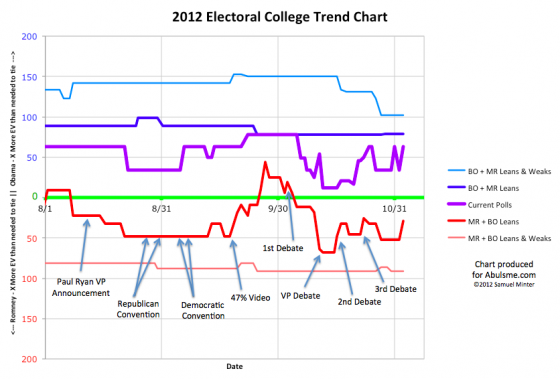
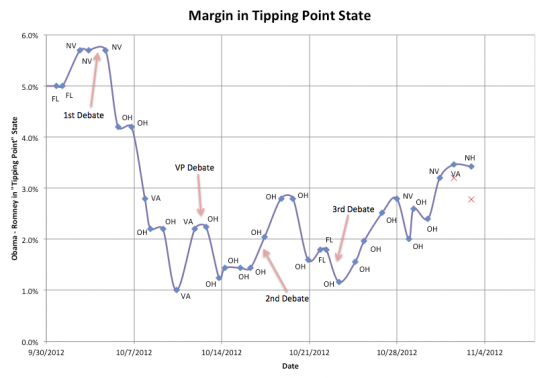
As usual since the range between the best cases includes the possibility of both candidates winning, it is time to look at the margin in the tipping point state:
The outlier in Virginia effects this chart as well, so I’ve added red x’s that show where the line would have been if I had excluded that data point.
With or without the outlier, Obama’s lead in the tipping point state is a little less than it was previously. With the outlier included, the tipping point is now New Hampshire, where Obama is ahead by 3.4%. If you excluded the outlier, the decline is more pronounced, the tipping point would be Virginia, where Obama’s lead would be 2.8%.
The degree of the dip is within the size of the swings this metric has shown over the last few weeks though. It may be the start of a trend toward Romney, or it may just be noise in this way of measuring things. Only a few more days left to find out.
If you look at each of the swing areas, you can find movement in both directions. Just comparing my data from yesterday to my data from today, we have Ohio (18), North Carolina (15), Colorado (9) and Iowa (6) moving toward Romney while Florida (29), Virginia (13), Wisconsin (10), Nevada (6) and New Hampshire (4) all move toward Obama. Pennsylvania (20) and Nebraska-2 (1) didn’t change as there were no new polls in either today. Daily numbers are noisy. You need to look at the overall trend.
The net effect right now: Obama is still ahead, but the tipping point (with or without the Virginia outlier) is getting a little bit closer than it was.
All eyes have been on Ohio. Ohio has gotten closer than it was. Obama’s margin is down to 2.3%. But with Ohio closer, other states like New Hampshire, Nevada and Virginia become the tipping point, and Obama still has larger margins there.
Romney still needs to get a significant movement in his direction to win. Or just hope that all the state polls are wrong.
Obama remains a heavy favorite for the electoral college, but a Romney upset COULD happen. If you were going to bet on this race though, you clearly should be betting on Obama.
Betting against Obama means you think either that Romney can make up an approximately 3% deficit in the key states in a matter of days, or that the state level polls in the key states are all biased toward Obama by the same margin.
Romney’s lead in the national polls seems to be diminishing in the last few days though, with things looking more tied than anything else. So the possibility of an electoral college / popular vote split may be slipping away. Oh well, that would have been fun!
Note: Chart and map from the Abulsme.com 2012 Electoral College Prediction page. Both assume Obama vs Romney with no strong third party candidate and show polling as it currently exists. Things will change before election day. On the map red is Romney, blue is Obama, gold states are too close to call. Lines on the chart represent how many more electoral votes a candidate would have than is needed to tie under several different scenarios. Up is good for Obama, Down is good for Romney.
